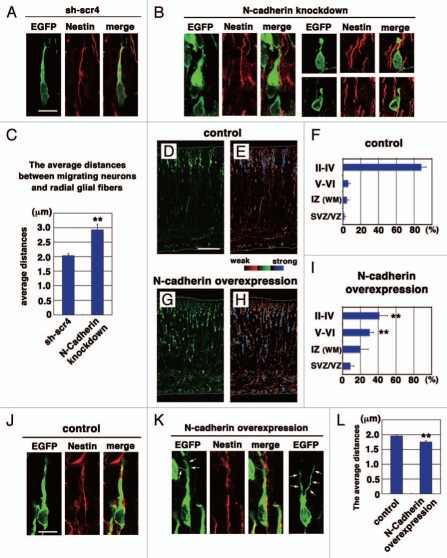
Figure 1.
Effects on N-cadherin knockdown or overexpression on the locomotion mode of neuronal migration. (A, B, J and K) The morphologies of N-cadherin knockdown or overexpressing locomoting neurons in the intermediate zone of E17 cerebral cortices. The neurons were electroporated with the following plasmids plus pCAG-EGFP19 at E14; Neurons in (A, B, J and K) were electroporated with control scrambled short hairpin RNA (sh-scr4: the negative control vector of pSilencer3.1-H1-neo, Ambion), short hairpin RNA for N-cadherin (NC-sh1023),15 control vector (CAG-MCS2, 10 µg/µl),25 or N-cadherin-expressing vector (CAG-human N-cadherin, 10 µg/µl),23 respectively. Green and red represent immunostaining signals for EGFP or Nestin, a marker for radial glial fibers, respectively. Arrows in (K) indicate branched leading processes. In utero electroporation and immunohistochemistry were performed as described previously in references 15 and 19. (C and L) The distance between the center of the cell soma of the cells with one thick process in the intermediate zone and the nestin-positive radial glial fiber to which they attach were deduced by Leica SP5 confocal microscopy. Each bar represents the average distance ± SEM. The average distance was significantly increased in N-cadherin-knockdown conditions (sh-scr4: 2.03 ± 0.07 µm, NC-sh1023: 2.92 ± 0.19 µm, p < 0.0001, t-test), whereas it was slightly but significantly decreased in N-cadherin-overexpression (control vector: 1.95 ± 0.04 µm, CAG-N-cadherin: 1.75 ± 0.05 µm, p < 0.01, t-test). (D–I) Cerebral cortices at P0, electroporated with control vector (CAG-MCS2, 10 µg/µl)25 or N-cadherin-expressing vector (CAG-human N-cadherin, 10 µg/µl),23 plus pCAG-EGFP at E14. EGFP fluorescent signals were shown as green in (D and G) or different colors as indicated by the color bar in (E and H). The graphs in (F and I) show the estimation of cell migration, which was carried out by recording fluorescence intensities of EGFP in distinct regions of the cerebral cortices using Leica SP5 software. Each bar represents the mean percentage of relative intensity ± SEM. n = 4 brains. The quantification method was described previously in references 14 and 19. II–IV, layers II–IV of the cortical plate; V–VI, layers V–VI of the cortical plate; IZ, intermediate zone; WM, white matter; SVZ/VZ, subventricular zone/ventricular zone. Scale bars: (in A) A, B, 10 µm; (in D) D, E, G and H, 200 µm; (in J) J and K, 10 µm.

