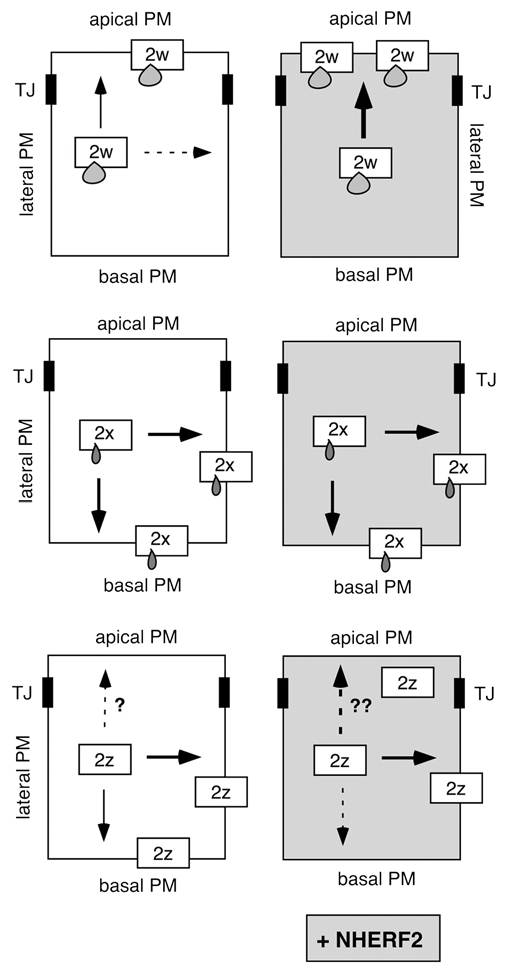
Figure 2.

Scheme illustrating the effect of NHERF2 on the distribution of PMCA2b splice site A variants in epithelial cells. Arrows indicate the direction of targeting of PMCA2w/b (top), PMCA2x/b (middle) and PMCA2z/b (bottom) in polarized MDCK cells, in the absence (left parts) and presence (right parts) of co-expressed NHERF2. A stippled arrow indicates a minor fraction of the PMCA is distributed in that direction. The three splice site A variants differ only in the size of the insert in their first intracellular loop, as illustrated schematically by small “drops” on the boxes representing the 2w, 2x and 2z variants. Note that upon NHER F2 expression, PMCA2w/b is greatly enhanced in the apical membrane (as indicated by the thick black arrow), whereas PMCA2x/b is unaffected and remains basal and lateral. The effect of NHER F2 on the distribution of PMCA2z/b is not yet clear, as indicated by the broken arrows with question marks. TJ, tight junction.
