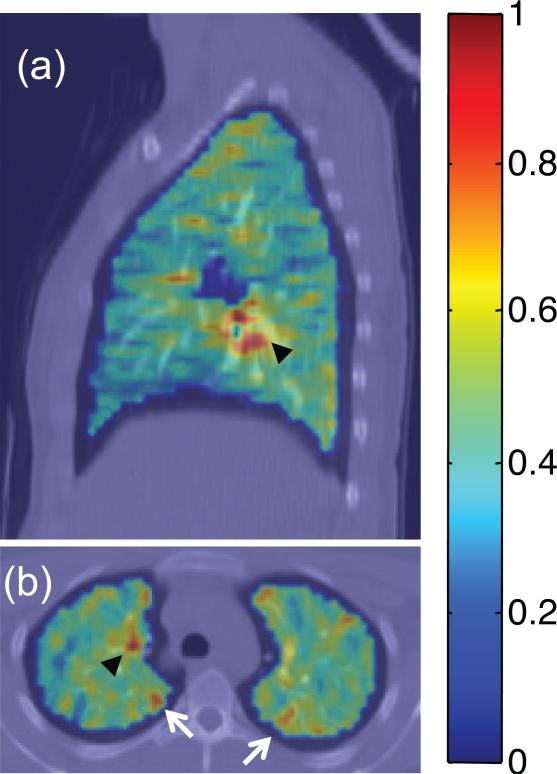
Figure 6. PET imaging of the lungs.
Fluorodeoxyglucose (FDG) PET/CT images depicting standardized uptake value (SUV) parametric maps overlain on CT images for a subject with mild persistent asthma during a respiratory tract infection. Areas of uptake on both (a) sagittal and (b) axial slices indicate mediastinal lymph node inflammation (black arrowheads), and selected peripheral areas of localized airway inflammation (white arrows in b).

