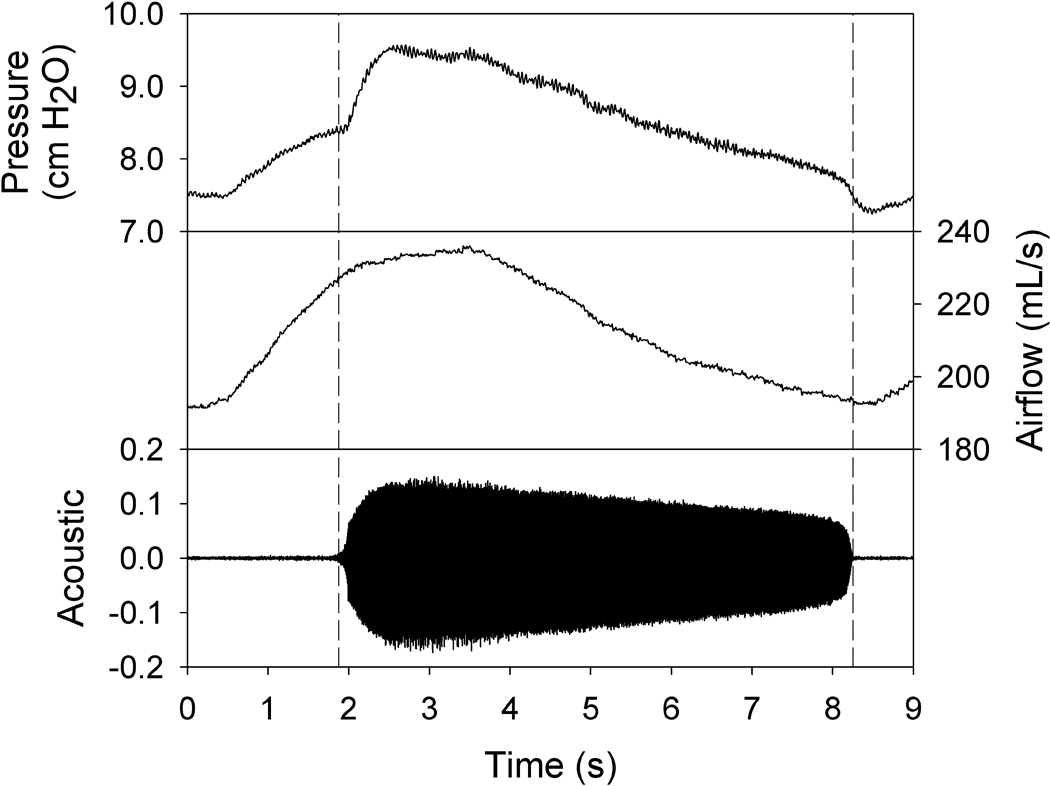
Figure 2.

Example graphs of acoustic, airflow, and pressure measurements obtained from larynx 9 at normal elongation. Airflow was increased until the phonation onset occurred (left vertical line), at which point the computer recorded the onset phonation threshold acoustic, airflow, and pressure data. Airflow was then gradually decreased until the phonation offset occurred (right vertical line), at which point the computer recorded the offset phonation threshold acoustic, airflow, and pressure data.
