
Figure 5.
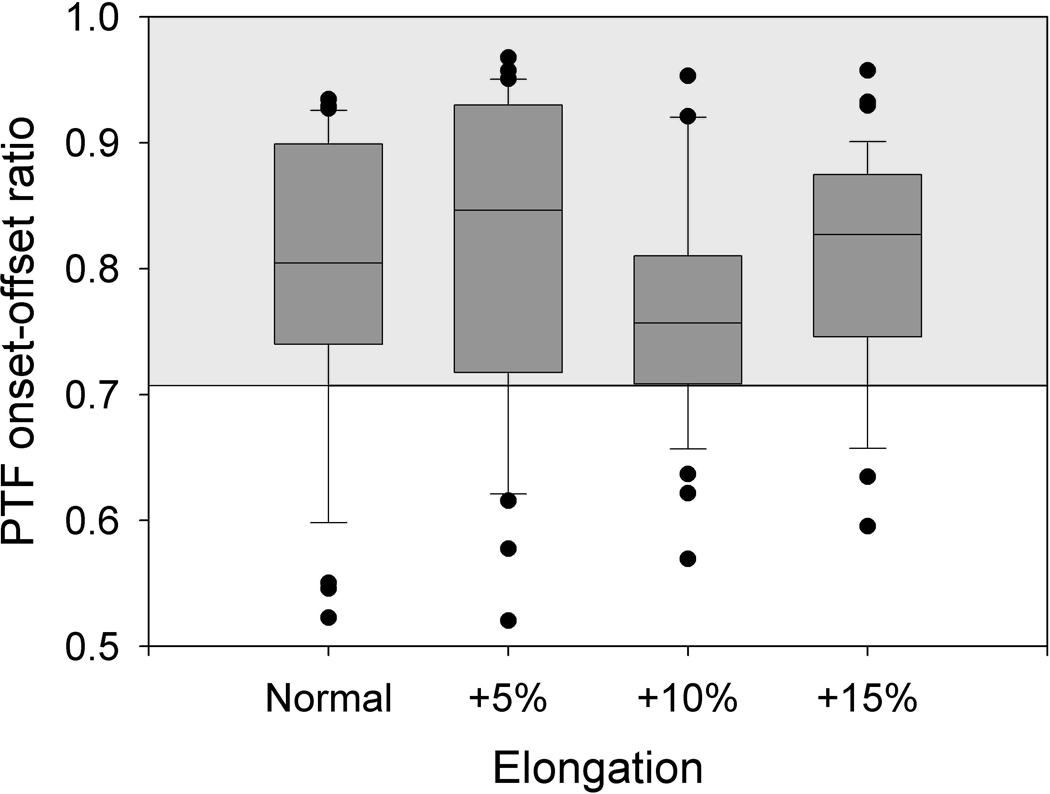
PTF onset-offset ratios for each elongation level. The upper and lower edges of the box represent the 75th and 25th percentile, respectively, and a line within each box marks the median PTF for the given elongation level. Whiskers above and below each box represent the 90th and 10th percentiles, respectively. Statistical outliers are graphed as points. The horizontal lines at 0.707 and 1.0 indicate the theoretically expected lower and upper bounds of the data. The majority of the data (80.0% of all data points) fell within the theoretically expected range (shaded).