
Fig. 2.
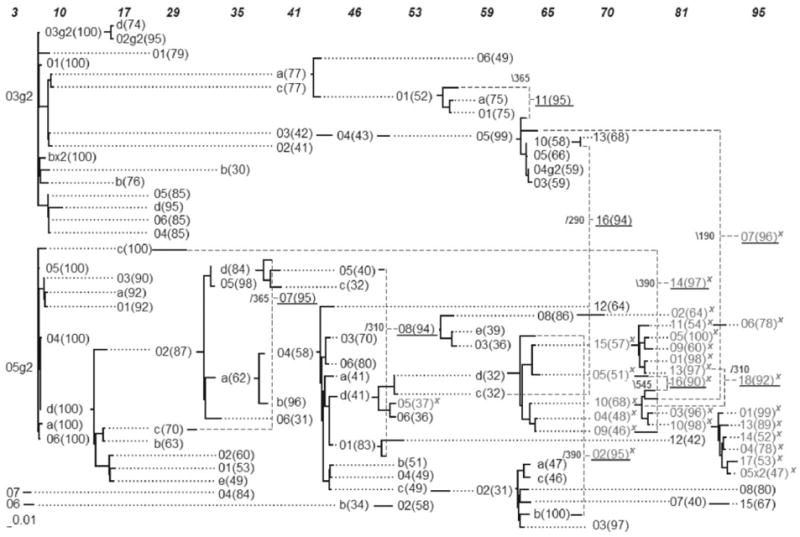
Proposed visualization of the consensus serial evolutionary network showing the relationships of serially-sampled HIV-1 sequences from patient 8 of Shankarappa’s study. The sequence IDs are unique within a sampling time point (shown on top), but not across the whole network. Bootstrap values are shown in parenthesis. Sequences with the X4 mutation are marked with an ‘x’. Solid lines indicate distances, while dotted lines serve to extend the linking relationships. Dashed lines are used to link recombinant sequences with their predicted donor sequences and breakpoint positions are shown in small font next to the underlined recombinant sequences.