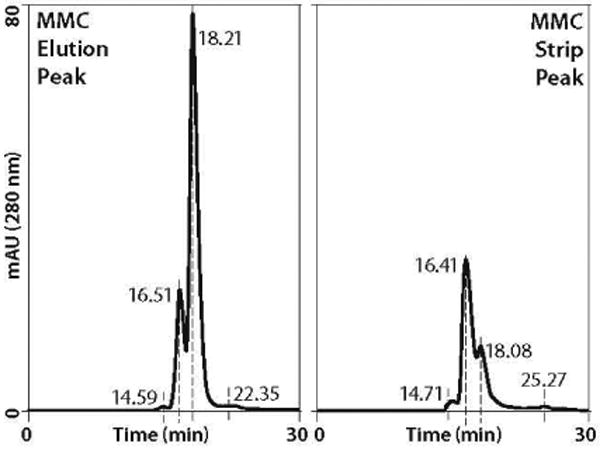
Figure 7.

Dimer and aggregate distribution in MMC fractions; (left) a Superdex 75 profile of the MMC eluate with dimer peak at 16.51 minutes, higher aggregates at 14.59 minutes; (right) the SEC profile of a 1 M NaCl strip dominated by dimer and aggregates. Note that the minibody apparently coelutes on center with contaminating BSA at about 18.2 minutes. Compare with Figure 9.
