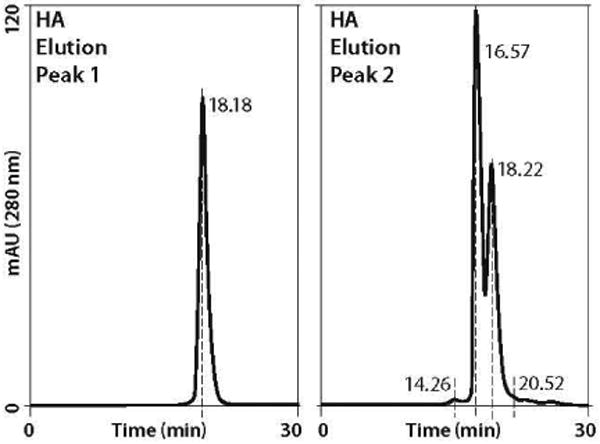
Figure 9.

Dimer and aggregate removal by HA (chromatogram in Figure 4); the first HA peak is essentially all nonaggregated minibody; the second is dominated by dimers and aggregates. Peak 2 was concentrated before application to SEC. Compare with Figure 7; refer to Table 2 for relative amounts of minibody in the respective fractions.
