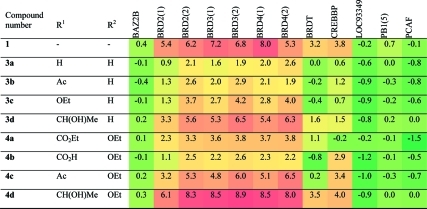
Table 2. ΔTmobs against Selected Bromodomainsa.
Compound concentration, 100 μM; protein concentration, 2 μM. Heat map shows relative ΔTmobs; red indicates large ΔTmobs, and green indicates small ΔTmobs. Experiments were carried out in duplicate; average values are reported.

