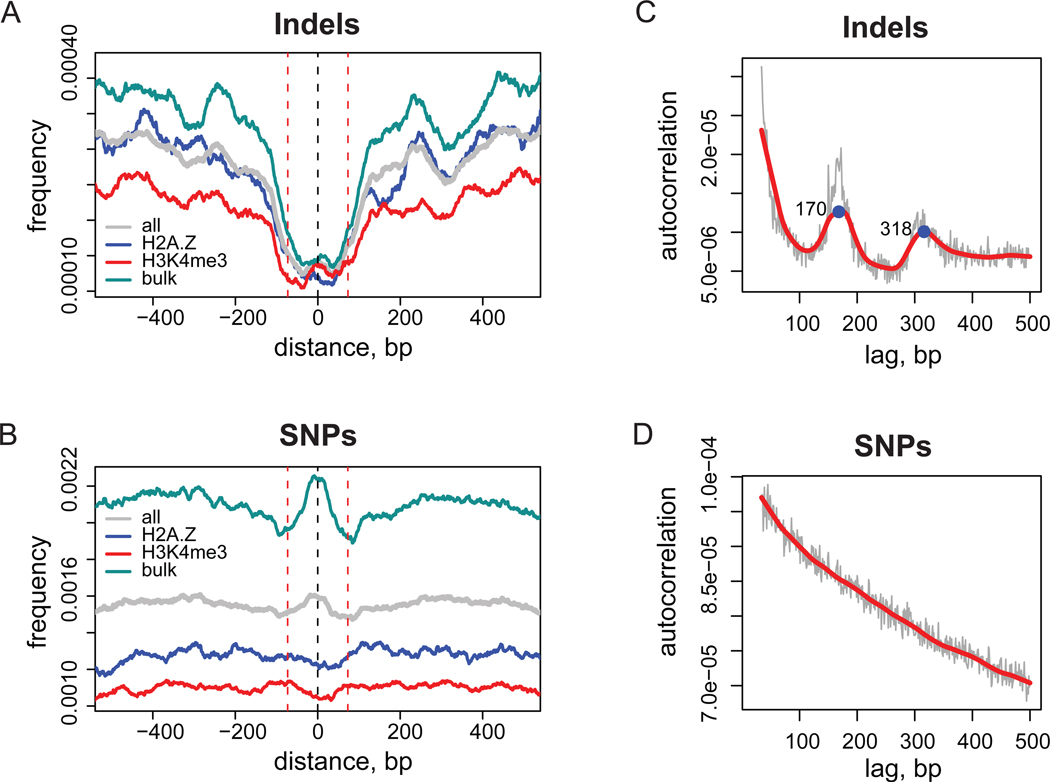
Figure 1.
Genome-wide distributions of indel and SNP events. (A,B) Distributions of indel (A) and SNP (B) frequencies around stable nucleosome positions. Results are shown for a combined set of nucleosome positions (grey) and for individual nucleosome sets: bulk (cyan), H2A.Z (blue), and H3K4me3 (red). The frequency profiles were normalized and smoothed as described in Methods. Black dashed line at position zero corresponds to the center of nucleosome position and red dashed lines at positions ±73 bp give reference of nucleosomal size. (C,D) Auto-correlation profiles for indel (C) and SNP (D) occurrences. Thin grey lines correspond to the initial profile calculated with one base-pair lag increments and thick red line represents loess smoothing of the initial data. Two local maxima in the indel profile corresponding to mono- and di-nucleosomal sizes are indicated with numbers.

