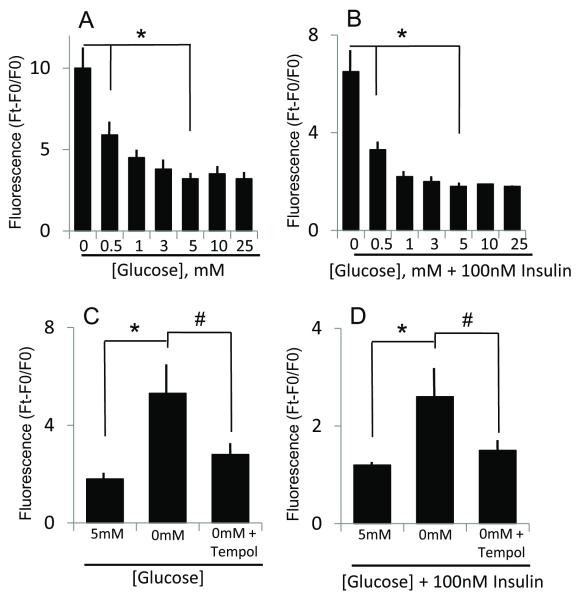
Figure 9. Reduced glucose and combined low glucose and insulin conditions induces ROS production.
Panel A shows the influence of various glucose concentrations on ROS production, as measured by rhodamine 123 fluorescence, expressed as Ft-F0/F0 where Ft and F0, represents the fluorescence at times, 8h and 0h, respectively. Increases in fluorescence at 0 or 0.5mM glucose were significantly higher (* p< 0.01) than that at normal (5 mM) media glucose. Panel B illustrates the influence of 100nM insulin on ROS production under various glucose status. ROS production under combined conditions of glucose (0 and 0.5 mM) and insulin was significantly higher (*p< 0.001, 0.01) than at 5mM glucose plus insulin. Panel C and D respectively show the effect of tempol on ROS production induced by hypoglycemia (0mM glucose, C) or by combined hypoglycemia and insulin (D). The attenuation of rhodamine fluorescence by tempol is consistent with elevated ROS production. * p<0.001, 0mM glucose versus 5 mM glucose (without or with insulin); # p<0.001, 0 mM glucose versus 0 mM glucose plus tempol (without or with insulin).

