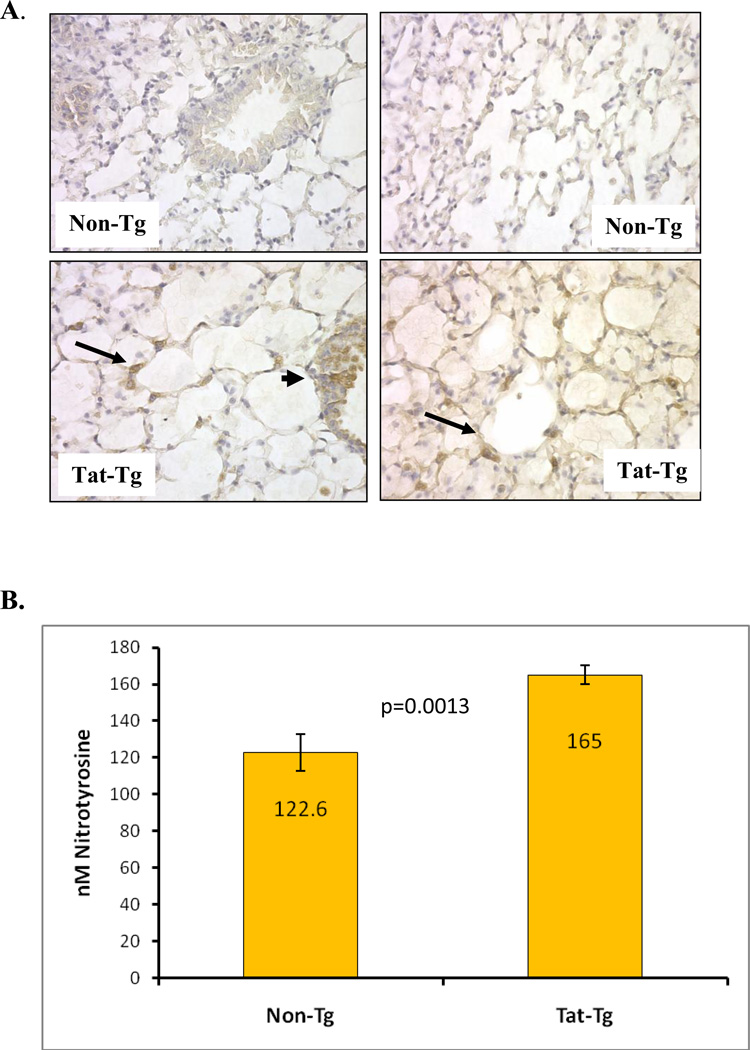
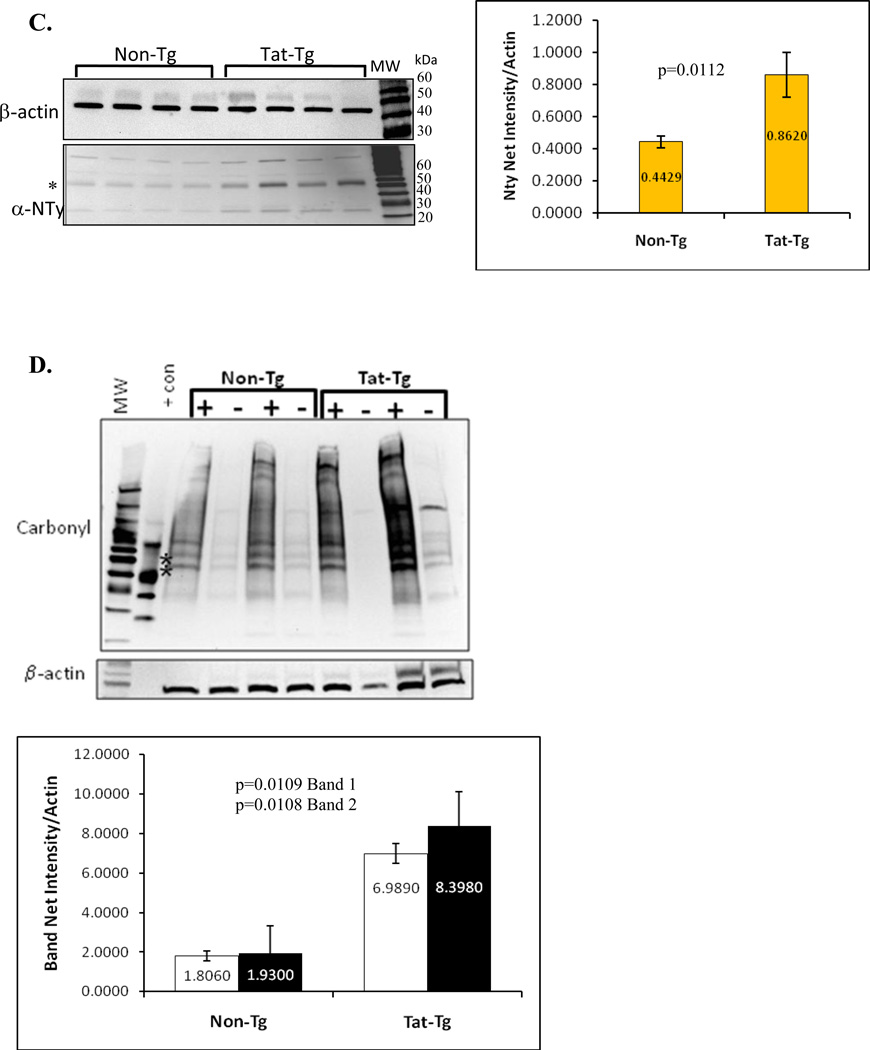
Figure 5. Modification of proteins by nitrotyrosine is evident in tat-transgenic but not in non-transgenic littermates.
Panel A. Immunohistochemical detection of nitrotyrosine in lung sections from tat transgenic mice (bottom images) and non-transgenic controls (top images). All images shown were taken at 200X magnification. The images on the left show bronchial sections and those on the right show alveolar regions. Arrows point to areas of intense alveolar nitrotyrosine staining while arrowheads point to bronchial staining. Panel B. Levels of nitrated tyrosine in proteins from lungs of Tat transgenic mice and non-transgenic controls were quantified by ELISA. The numbers inside the bars represent the mean nitrotyrosine concentration (in nM) per group. The differences between tat-transgenic lines compared to the non-transgenics were statistically significant (p=0.0013). Panel C. Nitrated proteins from total lung extracts were detected by immublotting using anti-nitrotyrosine polyclonal antibody. To measure the relative intensity of one of the nitrated bands, indicated by the *, we performed densitometric analysis using Kodak 1D Imaging Software and normalized to the β-actin signal. There was a significant increased in the Tat-Tg mice. Panel D. Carbonyl modification of whole lung proteins was detected by immunoblotting using the Oxyblot system. Proteins were either derivatized (+) or not (−) with DNPH prior to electrophororesis, and following immunoblotting they were detected with an anti-DNPH antibody. To measure the relative effect of Tat on carbonyl protein formation we performed densitometric analysis using Kodak 1D Imaging Software of two of the bands, indicated by the * (band 1 is the top band and band 2 is the lower band), and normalized to the β-actin signal. The quantification results shown by the graph indicate a significant increase in carbonyl modifications in the Tat-Tg mice. In all cases, p values were calculated using an unpaired two-tailed Student t test between the groups, and the sample size (n) was 4 – 8 animals per group.


