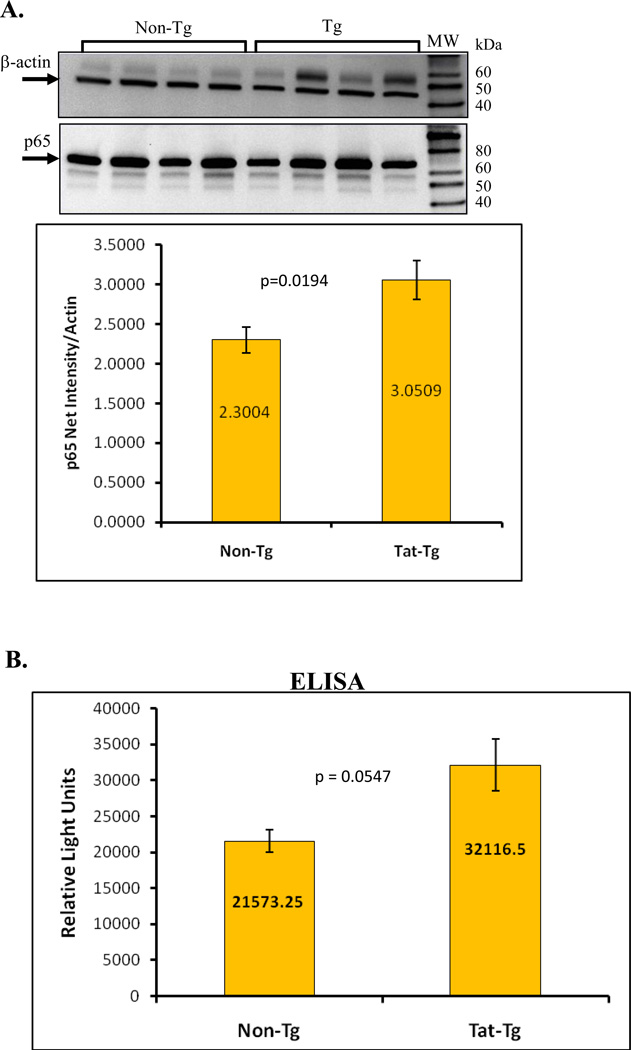
Figure 7. Detection of NF-kB p65.
Total p65 protein levels from whole lung protein extracts were detected by immunoblotting and activated p65 was measured by ELISA. Panel A. A representative immunoblot is seen along with the semi-quantitative results which show a significant increase in the Tat-Tg mice. The relative intensity of the p65 signal was measured densitometrically using Kodak 1D Imaging Software and was normalized to the β-actin signal. Panel B. ELISA of activated p65 indicates a significant increase in the levels of active p65 in the transgenic mice. In all cases, p values were calculated using an unpaired two-tailed Student t test between the groups. n = 4 – 8 animals per group.

