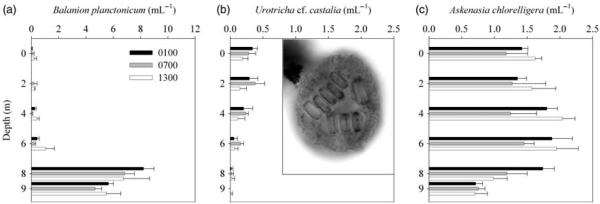
Fig. 2.
Abundance (mean number of cells mL−1 ± SD) along a depth gradient of Balanion planctonicum (a), Urotricha cf. castalia with insert showing a micrograph of a protargol-stained specimen taken at a magnification of ×1000 where several ingested centric diatoms are visible (b), and Askenasia chlorelligera (c) in Gossenköllesee on 10 August 2005 at T1 (0100), T2 (0700) and T3 (1300) local summer time. Note different bar scales.

