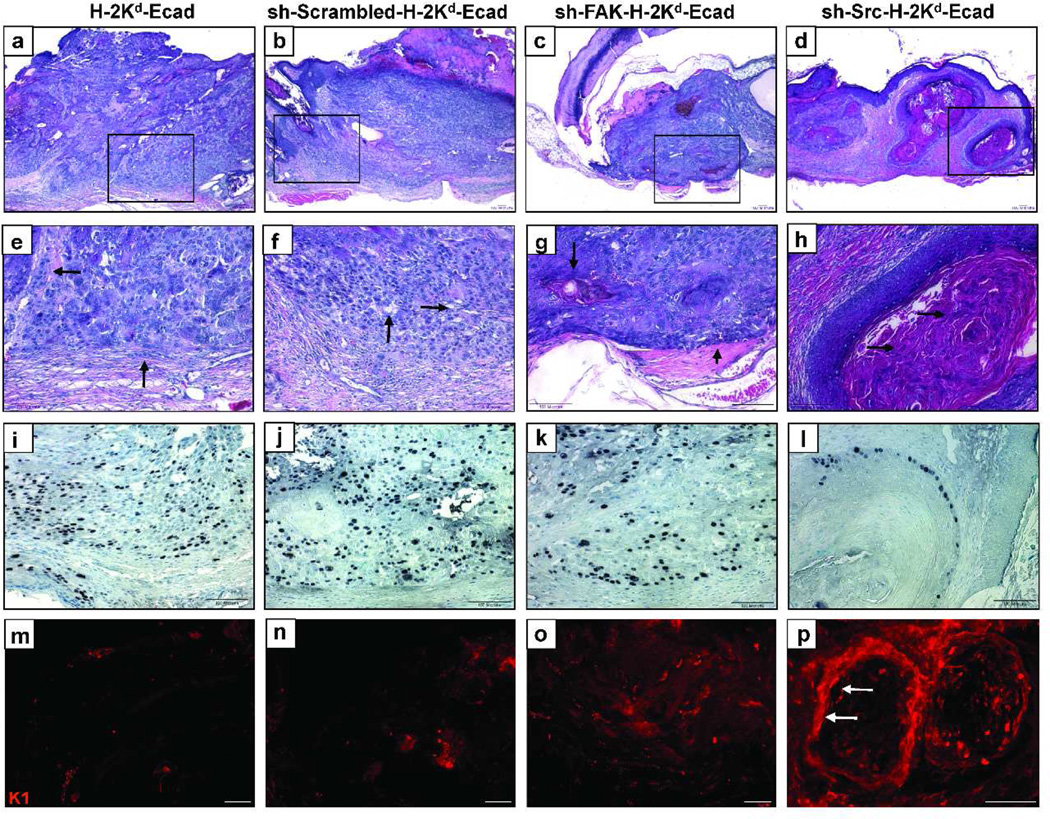
Figure 4. E-cadherin suppressed H-2Kd-Ecad-II-4 cells exhibit a switch from high-grade to low-grade tumors upon down-regulation of FAK or Src.
Images of H&E (panels a–d and in higher magnification panels e–h), Ki67 immunohistochemistry (i–l), and K1 immunofluorescence staining (m–p) of tumor sections. H-2Kd-Ecad- (a, e) and sh-Scrambled-H-2Kd-Ecad-II-4 tumors (b, f) showed poorly differentiated, invasive cells (e, f, arrows) and Ki67-positive tumor cells (i, j), while K1 was undetected (m, n). sh-FAK-H-2Kd-Ecad-II-4 tumors (c, g) showed tumor cell differentiation (g, arrow), disperse K1 (o), and Ki67-positive cells that were more limited to the tumor invasive edge (k). Well-differentiated sh-Src-H-2Kd-Ecad-II-4 tumor islands (d, h) showed keratin pearls (h, arrows), stratum-specific K1 (p, arrows), and Ki67-positive tumor cells at the periphery of the tumor clusters (l). Bar, 100µm.

