
Figure 2.
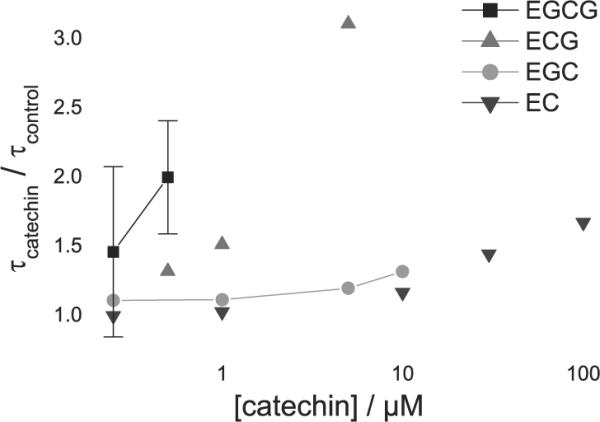
gA lifetime (τ) changes as a function of [catechin]. [Ala1]gA single-channel lifetimes, normalized relative to lifetimes determined before addition of the catechin; error bars show range for n = 2 and SE for n = 3–4. The large uncertainty in the EGCG results is due to the difficulties in determining the lifetimes of flickery channels, and the existence of long-lived subconductance states furthermore limited the concentration range that could be studied. 1 M NaCl or CsCl, 200 mV, filtered at 200–500 Hz.