Figure 3.

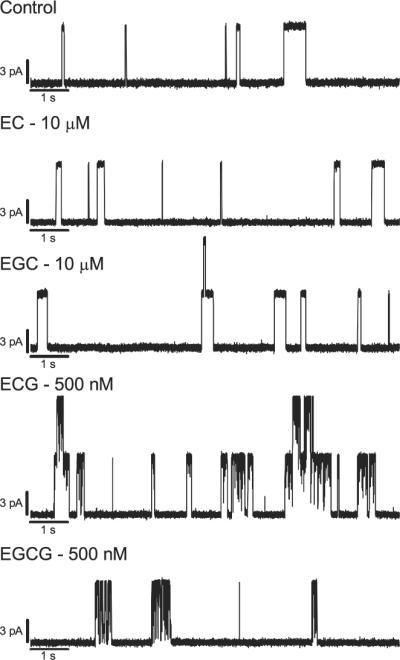
Single-channel current traces recorded in the presence of different catechins. [Ala1]gA current traces with: control, 10 μM EC, 10 μM EGC, 500 nM ECG, and 500 nM EGCG. 1 M CsCl, 200 mV, filtered at 1000 Hz.

Single-channel current traces recorded in the presence of different catechins. [Ala1]gA current traces with: control, 10 μM EC, 10 μM EGC, 500 nM ECG, and 500 nM EGCG. 1 M CsCl, 200 mV, filtered at 1000 Hz.