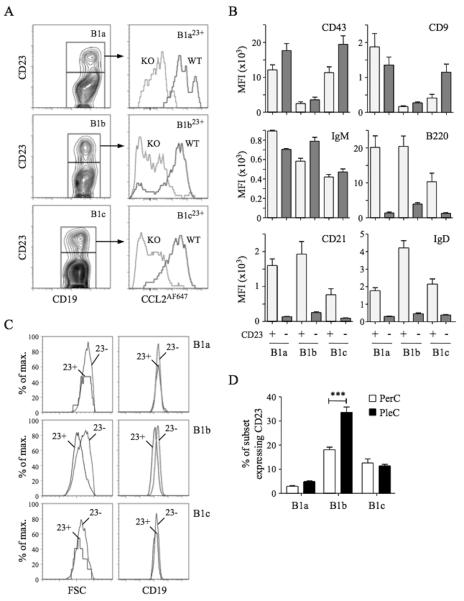
Figure 3. Characterisation of D6active body cavity CD23+ B1 cells.
(A) Left panels: Sub-fractionation of WT PerC B1a (CD19+CD11b+CD5+), B1b (CD19+CD11b+CD5−) and B1c (CD19+CD11b−CD5+) cells by anti-CD23. Right panels: Overlaid CCL2AF647 uptake profiles of WT (black) and D6-deficient (KO, grey) PerC CD23+ B1 cell subsets. (B) Surface immunophenotype of WT PerC CD23+ (light grey) and CD23− (dark grey) B1 cell subsets. Data show average Mean Fluorescence Intensity (+/−SEM). (C) Forward scatter (FSC) and surface CD19 of WT PerC CD23+ (23+) and CD23− (23−) B1 cell subsets. (D) Mean percentage (+/−SEM) of each B1 cell subset expressing surface CD23 in WT PerC and PleC lavages (n=5). ***p<0.001. Flow cytometry profiles are representative of data from >3 mice per genotype per experiment, with experiments repeated on at least 3 occasions.

