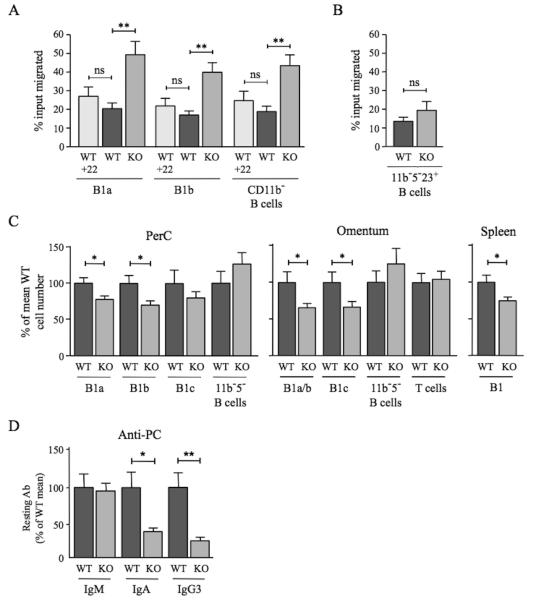
Figure 7. Impact of D6 deficiency on B1 cell motility, B1 cell abundance, and serum anti-PC levels.
(A) WT and D6-deficient (KO) PerC B cells that migrated in response to 100nM CXCL13 (plus 50nM CCL22 where indicated (+22)) were enumerated by flow cytometry after staining with antibodies against CD19, CD11b and CD5. Data are representative of at least three repeat experiments. (B) Proportion of WT and KO PerC CD5−CD11b−CD23+ B cells migrating towards 100nM CXCL13. A repeat experiment generated similar results. In A and B, data are presented as the mean number of live cells migrated (as percent of input) (+/−SEM) from at least four replicates. (C) Number of cells in the indicated B cell subsets in PerC lavage, omentum and spleen of WT and D6-deficient (KO) mice as a percent (+/−SEM) of WT (WT average set to 100%). PerC, 26 mice per genotype; omentum, 20 mice per genotype; spleen, 6 mice per genotype. ‘11b−5− B cells’ were CD19+CD11b−CD5−; omental T cells were FSCloSSCloCD19−CD11b− CD23−CD5hi. (D) Mean quantity of anti-PC Abs (+/−SEM) in the serum of resting WT and KO mice (9 per genotype). Mean WT levels set to 100%. Similar data were generated in a repeat experiment. *p<0.05; **p<0.01; ***p<0.001; ns, not significant.

