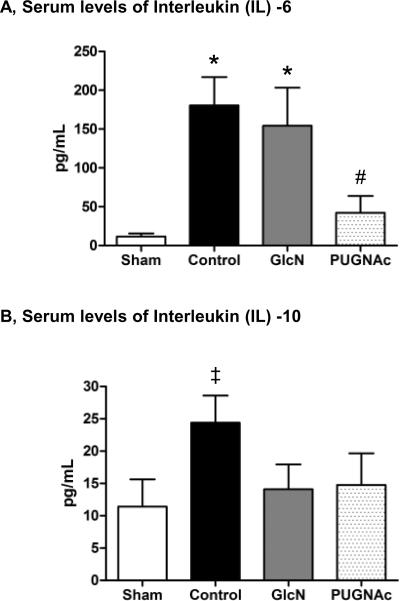
Fig. 2. Serum cytokine levels of A) Interleukin (IL) -6 and B) IL-10 24 hours after hemorrhagic shock and resuscitation.
Data are expressed as mean ± SEM, n>9 in each group. Panel A): ANOVA, * p<0.05 Vs Sham and# p<0.05 Vs Control. Panel B): ANOVA (trend to significance, overall p=0.08),‡ p<0.05 Vs Sham.

