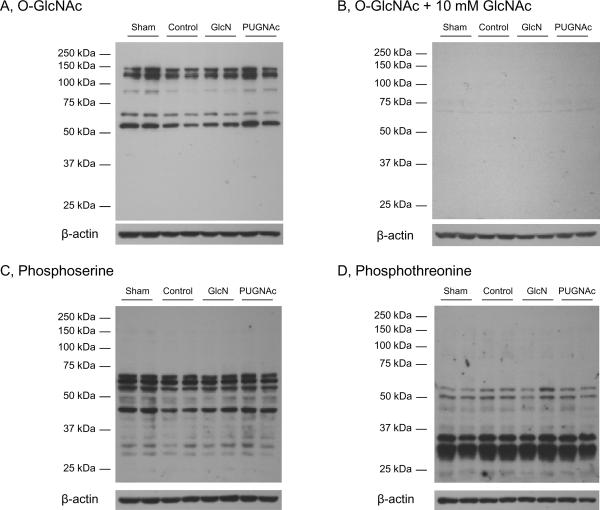
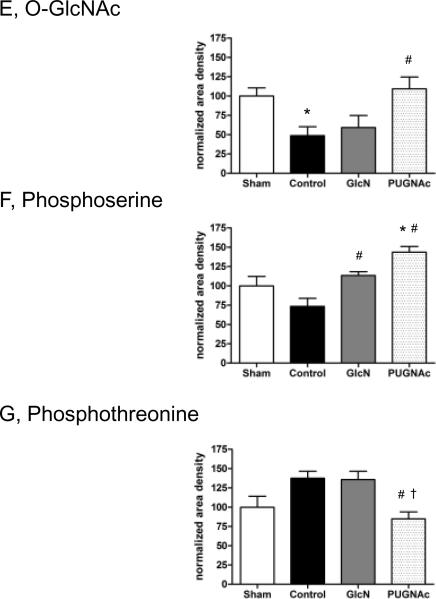
Fig. 9. O-GlcNAcylation and phosphorylation in the Liver tissue extracts 24 hours after hypovolemic shock and resuscitation.
Tissue samples were separated on 10% gels. Membranes were incubated with A) O-GlcNAc (CTD 110.6) antibody, B) O-GlcNAc antibody + 10 mM GlcNAc, C) Phosphoserine or D) Phosphothreonine antibodies. The representative blots show two-two selected samples of each group. Bar charts represent the mean area densities of E) O-GlcNAc, F) Phosphoserine and G) Phosphothreonine immunoblots, related to Sham animals. Mean densities were normalized to β-actin staining. Data are shown on bar charts as mean ± SEM, n=7 in each group. ANOVA, * p<0.05 Vs Sham,# p<0.05 Vs Control and† p<0.05 Vs GlcN group.


