Figure 3.
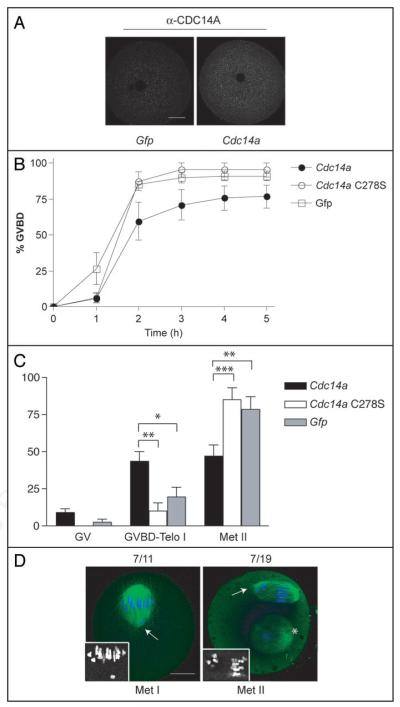
Overexpression of CDC14A delays meiotic progression after GVBD. (A) Oocytes were microinjected with the indicated mRNA and were held for 16 h in maturation medium containing milrinone prior to fixation and immunodetection of CDC14A. To estimate the level of overexpression the average intensities of the overexpressing cells (n = 15) were compared to the average intensities in Gfp-injected cells using Image J software. Scale bar is 20 μm. (B) Oocytes were injected with the indicated mRNAs and held in milrinone-containing medium for 4 h. The oocytes were washed out of the maturation inhibitor, and the absence of a GV (GVBD) was monitored every hour by light microscopy. These experiments were repeated 3 times, n = 60 for each group and the data are presented as the mean ± S.E.M. p = 0.0746 (2-way ANOVA) (C) Oocytes were injected with the indicated mRNAs, held in milrinone for 4 h and matured in the absence of milrinone for 16 h. Cells were fixed and stained with anti-β-tubulin (to visualize the spindle) and propidium iodide (to visualize DNA) to determine the meiotic stage. These experiments were conducted 3 times, n = 45 for each group. Two-way ANOVA was used to analyze the data and the data are presented as the mean ± S.E.M. *p < 0.05, **p < 0.01, ***p < 0.0001. (D) Representative images of oocytes overexpressing CDC14A where DNA is blue, and the spindle (β-tubulin) is green. The insets contain zoomed in black and white images of the chromosomes at Met I and Met II. The scale bar is 20 μm, the asterisk indicates a polar body and the arrows point to misaligned chromosomes.

