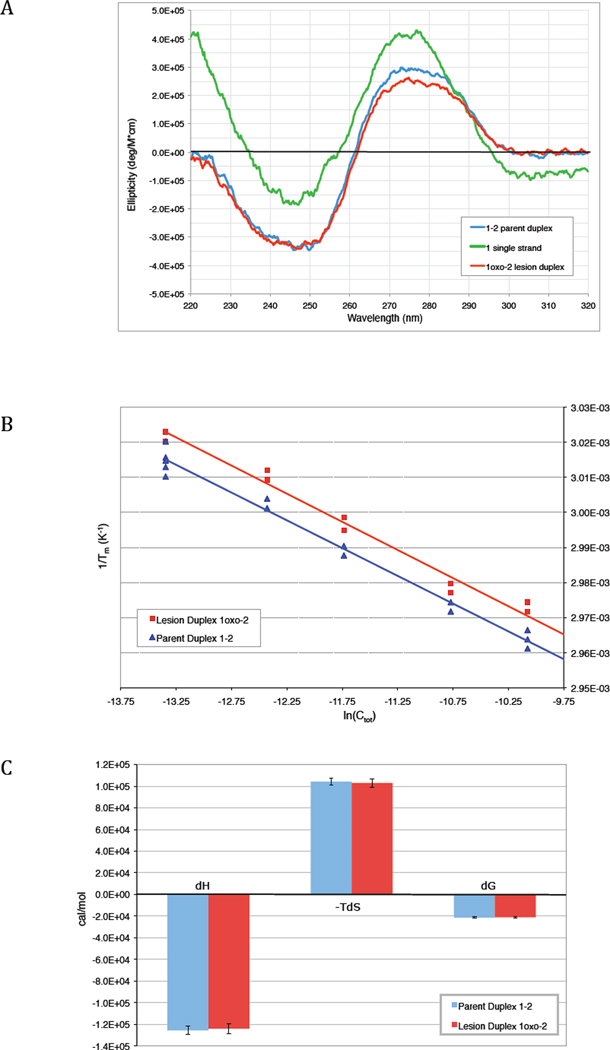
Figure 1. Circular dichroism spectrum and UV melting thermodynamics.
(a) CD spectrum of parent duplex 1–2, lesion duplex 1oxo-2, and single stranded 1 in sodium phosphate buffer at 10°C. Each strand was present at 8 µM concentration. The shapes of the parent 1–2 and lesion 1oxo-2 duplex spectra (blue and red, respectively) are similar to each other and also consistent with previously published spectra for B-form DNA double helices. (B) van't Hoff plot of the relationship between duplex concentration and melting temperature for parent duplex 1–2 (blue) and lesion duplex 1oxo-2 (red), as described by Eqn. 1. (C) Comparison of the thermodynamic parameters ΔH, −TΔS, and ΔG for formation of the parent (blue) and lesion (red) duplexes at 298 K.

