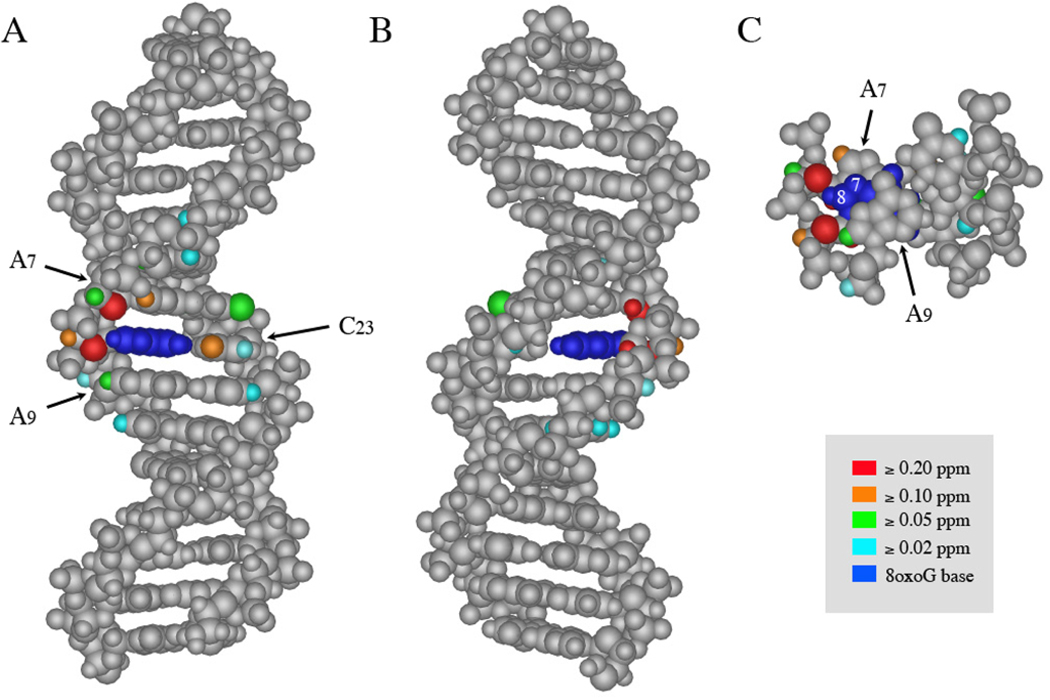
Figure 4. Chemical shift differences between parent and 8oxoG duplex NOESY spectra.
Model of duplex 1–2 shown from (A) the major groove, (B) the minor groove, and (C) along the helical axis. Each model is color-coded as indicated in the legend to indicate the magnitude of differences in chemical shift between protons on the parent and lesion duplexes. Guanine 8's base is colored royal blue for clarity; the chemical shift of its imino proton changes significantly due to major electronic differences between guanine and 8oxoG. The default grey color indicates that 1. the chemical shift of the proton did not change (i.e. the protons on the terminal 4 bp at either end of the duplex); 2. the proton chemical shift was not assigned (i.e. the H4' and H5' protons); or 3. the atom is not a hydrogen and/or does not have a hydrogen attached to it that could be assessed by this method (i.e. backbone phosphates, portions of the aromatic bases). The values of all of the chemical shifts included in this figure are tabulated in Supplemental Table 4. Where protons could be measured spectroscopically but are not shown explicitly in this diagram, the carbon or nitrogen to which they are attached has been shaded instead. In panels (A) and (B), the C1–G30 base pair is shown at the top of the duplex. In panel (C), only nucleotides A7-G8-A9 and their complements are shown; the guanine N7 and C8 positions are labeled with white numbers.

