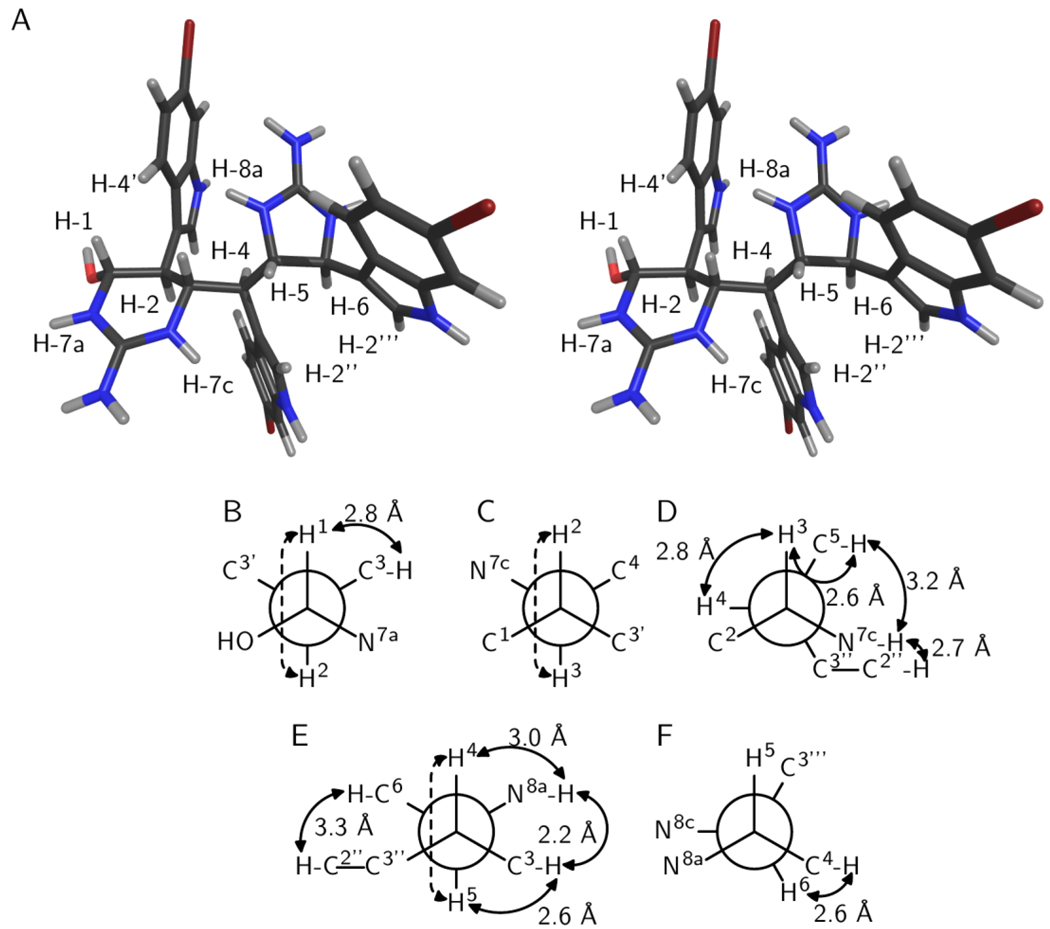
Figure 1.
Relative configuration of araiosamine A (1). (A) Cross-eyed stereogram of a low energy conformer that satisfies the experimental restraints. (B–F) Newman projections along the backbone bonds in the low energy conformer depicted in (A). Solid double-ended arrows indicate experimental NOE correlations were observed for the indicated pair. Distances in the model are shown by each arrow. Dashed arrows indicate 3JH–H > 8 Hz for the indicated pair. (B) Projection for bond C-1/C-2. (C) Projection for bond C-2/C-3. (D) Projection for bond C-3/C-4. (E) Projection for bond C-4/C-5. (F) Projection for bond C-5/C-6.

