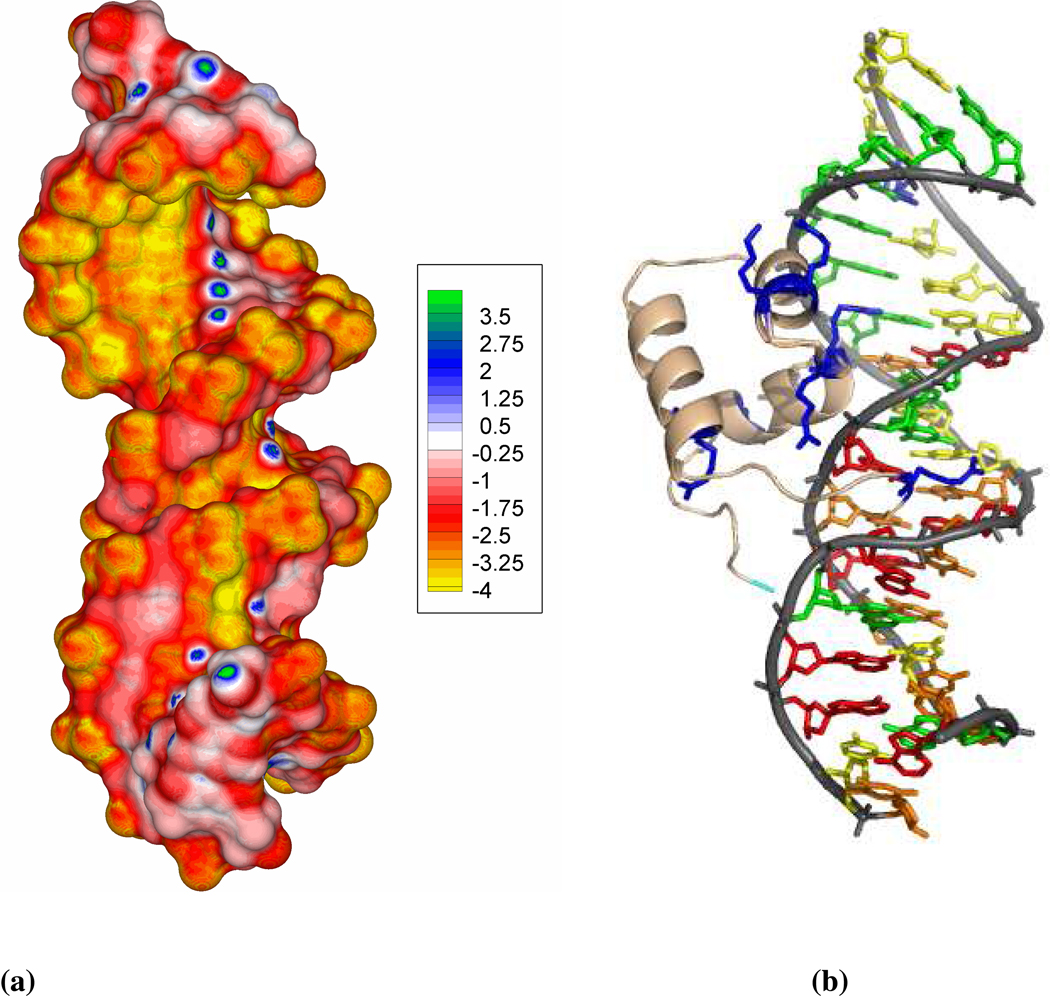
Figure 8.
(a) The surface potential of the deformed and non-linear DNA. Radii and atomic charges are assigned using the Amber force field. This unique A/B junction DNA structure generates a surface potential map with characteristics of an A-DNA major groove and B-DNA minor groove. A continuous high negative potential band along the G-stretch along with electropositive spots due to amino groups of cytosine is observed for this nonlinear DNA structure. The electrostatic potential is given in units of kcal/mol/e. (b) The N-terminal DNA-binding domain of Tc3 transposase bound to the DNA (PDB id: 1TC3). The ribbon or tube-like representation of the DNA phosphate backbone is shown in light gray and that of the peptide backbone in gold. The cationic residues that penetrate in the narrow minor groove or face the G-stretch side of the major groove are shown in blue stick representation.

