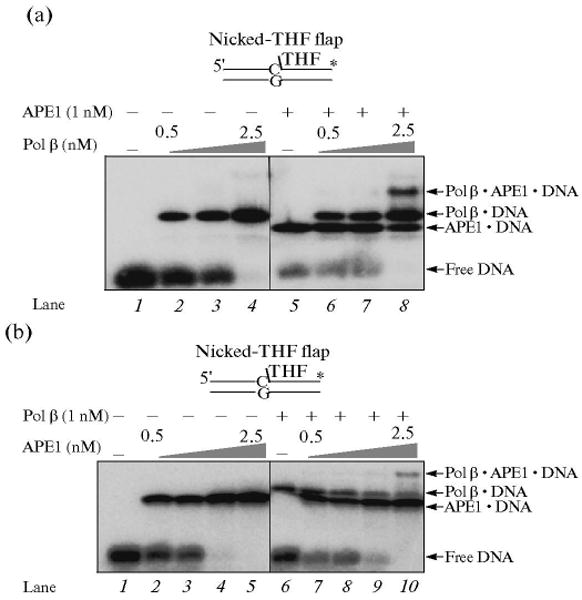
Fig. 9.

Formation of APE · polymerase β · DNA ternary complex. (a) Increasing concentrations of polymerase β were incubated with 5 nM nicked-THF flap substrate DNA in the absence (lanes 2–4) and presence of 1 nM APE1 (lanes 6–8). Lane 1 represents the binding mixture without enzyme. Lanes 2–4 correspond to mixtures containing increasing concentrations of polymerase β (0.5, 1, and 2.5 nM, respectively) and DNA. Lanes 6–8 indicate mixtures containing the same concentrations of polymerase β as lanes 2–4 along with 1 nM APE. Lane 5 indicates a binding mixture with APE and the DNA substrate. (b) Increasing concentrations of APE1 (0.5, 1, 2.5, and 5 nM, respectively) were incubated with 5 nm nicked-THF flap substrate DNA in the absence (lanes 2–5) and presence of 1 nM polymerase β (lanes 7–10). Lane 1 represents the reaction mixture without enzymes, whereas lane 6 corresponds to the mixture containing polymerase β and DNA substrate. The substrate DNA is schematically illustrated above the gel.
