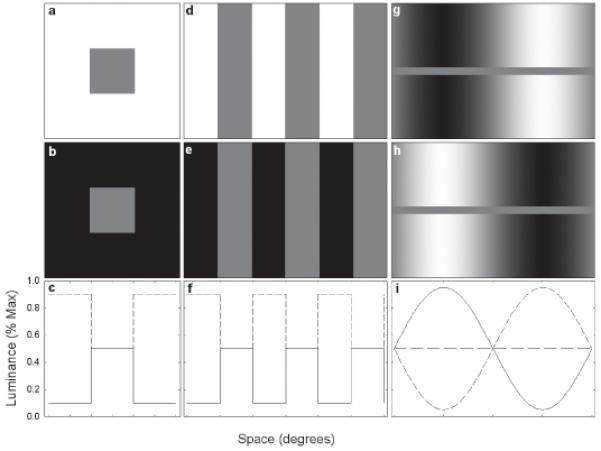
Figure 1.

Comparison of the SBC stimuli used by DeValois et al. (1986) (a-c) and Rossi and Paradiso (1996) (d-f) with the GI stimulus (g-i). The lower row of panels illustrates horizontal one-dimensional slices through the stimuli in the upper row (short-dashed lines) and middle row (solid lines) representing the two extreme temporal phases. Note that for the GI stimulus the homogeneous test field is represented by a separate horizontal slice (long-dashed line).
