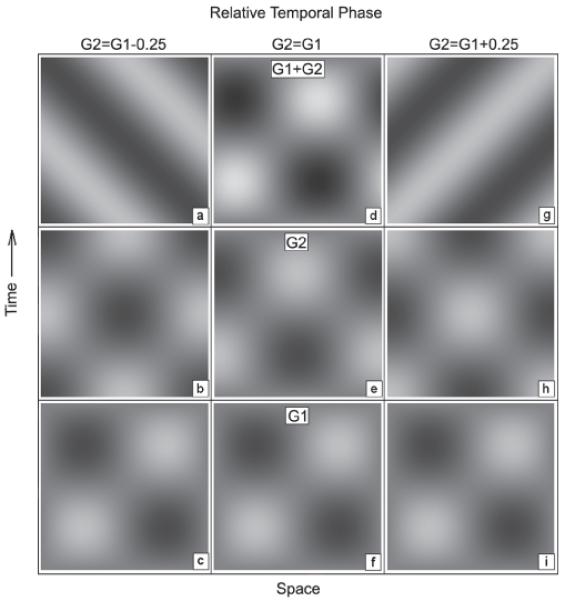
Figure 2.

Space-time diagrams illustrating the quadrature-motion experimental technique. Panels (c, f, i) illustrate one temporal cycle of a counterphasing grating (G1: luminance or induced). Panels (b, e, h) illustrate a luminance grating (G2) added to the test field in quadrature spatial phase to G1, in three relative temporal phases: −.25 cycles (b); 0 cycles (e) and +.25 cycles (h). Panels (a, d, g) illustrate the compound grating G1 + G2 for each combination. Leftward motion results when the temporal phase of G2 < G1, rightward motion occurs when G2 > G1, and motion energy is balanced when G2 = G1. Our technique identifies the temporal phase of an added luminance grating which matches the temporal phase of an induced grating (experimental condition) or of a luminance grating (control condition) and results in an ambiguous motion percept.
