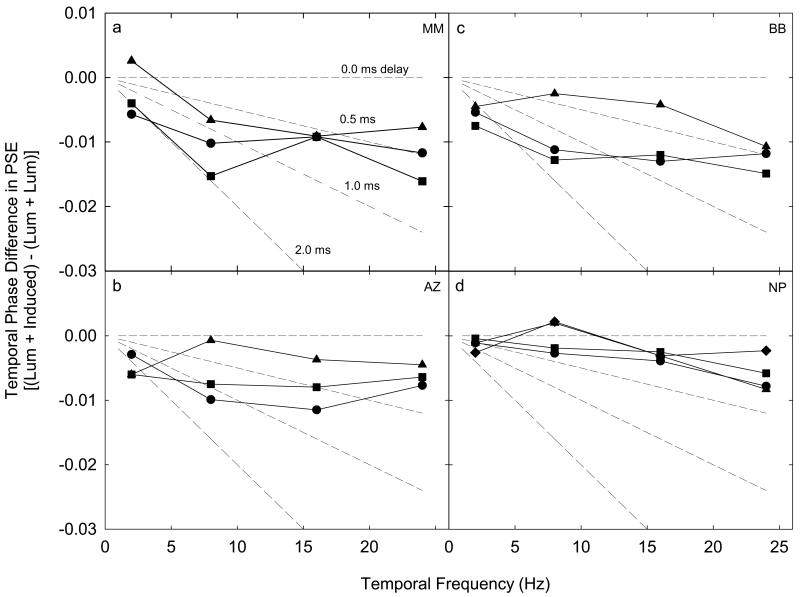
Figure 4.
The phase (time) lag of induction as a function of temporal frequency and test field height. Panels (a-d) plot separately for each subject the difference in the bootstrap PSEs between the experimental (luminance + induced) and control (luminance + luminance) conditions as a function of temporal frequency. Test field height is indicated by the different symbols (circles = 0.5°, squares = 3.0°, triangles = 6.0°, diamonds = 9.0°). The dotted lines depict the predicted differences in the PSEs between experimental and control conditions as a function of temporal frequency which would correspond to fixed induction time lags of 0.0, 0.5, 1.0 and 2.0 ms.

