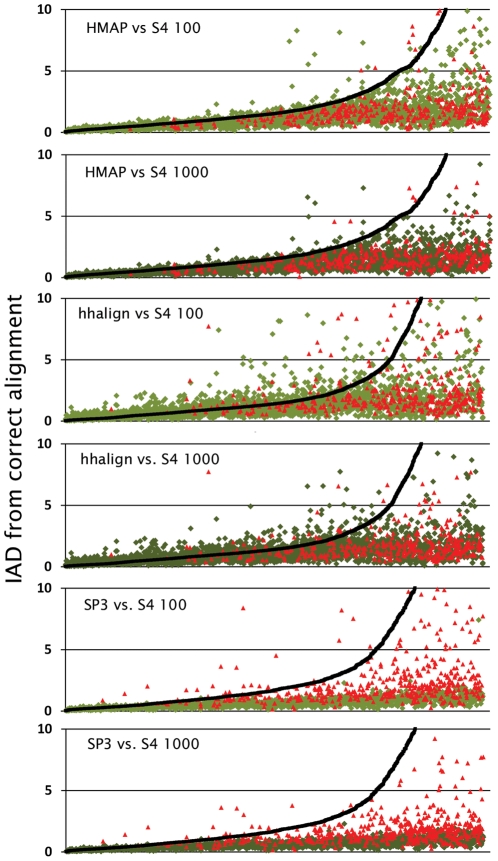
Figure 2. Accuracy of S4 compared to optimal DP-based alignments.
For each query/template pair in our benchmark set, we plot two points: one representing the accuracy of the alignment generated by a DP-based method (black squares) and one representing the accuracy of the best alignment from an ensemble generated by S4 (green diamonds and red triangles). Accuracy is calculated using “inter-alignment distance” (IAD, y-axis) from the correct, structure-based sequence alignment and the query/template pairs are ordered along the x-axis according to IAD of the DP-based alignment (lower IAD implies higher accuracy). We take the best S4 alignment from two different ensembles and compare to three DP-based methods indicated in each graph (e.g., the graph labeled “hhalign vs. S4 1000” compares hhalign to the best S4 alignment from an ensemble of 1000 and “SP3 vs. S4 100” compares SP3 to the best S4 alignment from an ensemble of 100, etc.) The green diamonds represent query/template pairs where the template was identified by the DP-based method. Red triangles represent those pairs where the template could only be found by structural comparison to the native structure. Each graph contains data only for those query/template pairs for which an alignment could be generated by the DP-based method (3,343 pairs for HMAP, 2,952 for hhalign and 1,654 for SP3).

