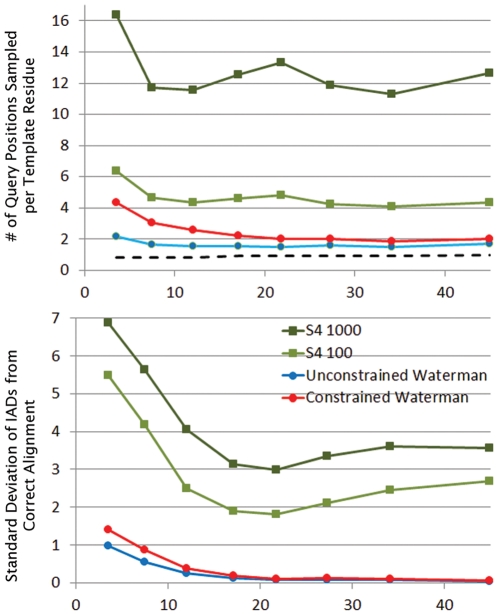
Figure 5. Diversity of alignments in the S4 ensemble.
In the top panel we plot on the vertical axis the number of unique query residues sampled at each template residue position in the S4, unconstrained Waterman and constrained Waterman alignment ensembles. For comparison, the optimal alignment sampling, which is necessarily at most one query position per template residue, is also shown. In the bottom panel, we instead plot the standard deviation of the IAD from the correct alignment for each ensemble. A greater standard deviation implies a larger portion of alignment space sampled. In both graphs, the data points represent averages for query/template pairs grouped on the horizontal axis according to sequence identity as in Figure 3. The different ensemble sizes used for S4 are shown in the inset legend and an ensemble size of 1,000 was used for the Waterman based approaches.

