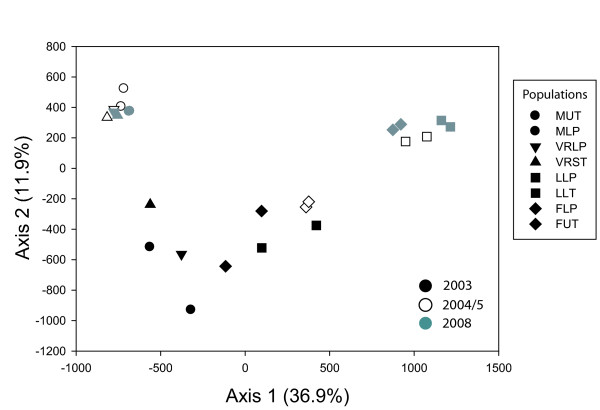
Figure 2.
Factorial correspondence analysis depicting genetic differentiation among A. uncatus populations over multiple years. Factorial correspondence analysis based on allele frequencies of A. uncatus depicting the spatial representation of genetic differentiation among populations over multiple years. Inertia of each axis is given in parentheses. Population codes as in Table 1.

