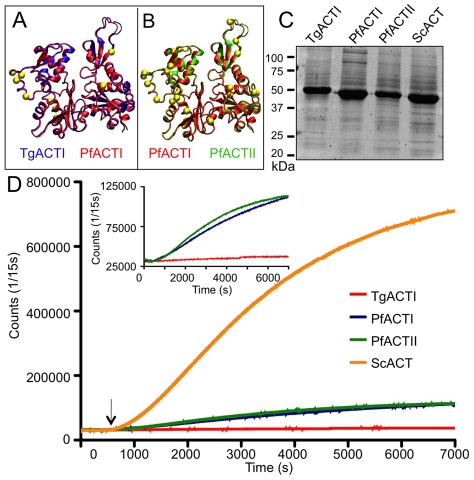
Figure 1. Apicomplexan actins differ in sequence and polymerization kinetics.
(A) Model of TgACTI (blue) mapped onto PfACTI (red) highlighting amino acid differences (yellow). (B) Model of PfACTI (red) mapped onto PfACTII (green) highlighting amino acid differences (yellow). (See supplementary Figure S6 for enlargement). (C) Expression of recombinant apicomplexan actins purified from baculovirus, resolved using a 12% SDS-PAGE gel, stained with SYPRO Ruby. (D) Comparison of actin polymerization kinetics. Polymerization of 5 µM actin was induced by the addition of F buffer (arrow) and monitored by light scattering. Insert shows parasite actins on the expanded Y-axis.

