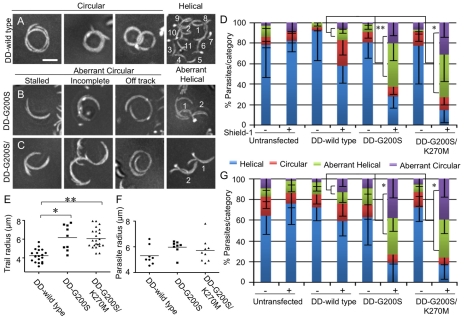
Figure 10. Parasites expressing stabilized actin undergo aberrant gliding motility.
(A) Representative composite videos of normal gliding motility by parasites expressing DD-wild type TgACTI. (B,C) Representative composite videos of gliding by parasites expressing stabilized actin mutants revealed examples of stalled, incomplete or off-track circular patterns and disrupted helical patterns that were classified as aberrant. For helical gliding, the number of complete turns made during the time-lapse sequence are numbered. Images are composite frames from 60 sec of video recording. Scale bars, 5 µm. (D) Quantification of number of parasites undergoing each category of gliding motility following treatment ± Shield-1 for 40 hr. The percentage of parasites undergoing aberrant gliding (as defined in B,C) increased in the presence of Shield-1 in the mutant actins as compared to wild type, * P<0.05 ** P<0.01, (Student's t-test). Mean ± S.D. (E) Comparison of radii of circular tracks formed during normal gliding by DD- wild type expressing parasites vs. parasites expressing mutant actins that formed aberrant circular tracks (i.e. stalled or off-track). * P<0.001 ** P<0.0001 (Mann-Whitney test). Mean shown by horizontal line. (F) Comparison of parasite curvature during normal gliding by DD-wild type expressing parasites vs. parasites expressing mutant actins that formed aberrant circular tracks (i.e. stalled or off-track). Data shown are the average curvature radii of individual parasites during gliding motility. (G) Quantification of number of parasites undergoing each category of gliding motility following treatment ± Shield-1 for 6 hr. The percentage of parasites undergoing aberrant gliding (as defined in B, C) increased in the presence of Shield-1 in the mutant actins as compared to wild type, * P<0.001, (Student's t-test). Mean ± S.D.

