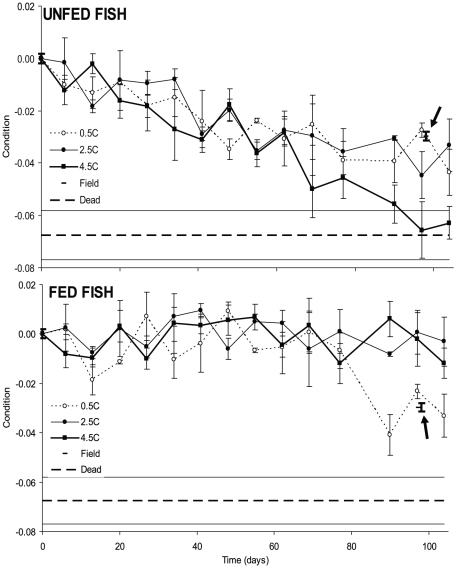
Figure 1. Standardized development of condition (K) for unfed (top panel) and fed fish (lower panel) at three different experimental temperatures.
Values at day 0 are based on fish caught in the field and data for field caught fish at day 98 are indicated by arrows. Punctured horizontal lines indicate average (± S.E.) standardized dry-weight condition of fish that died during the experiment. Error bars indicate S.E. and bold error bars indicate S.E. for fish caught in the field at day 0 and day 98.

