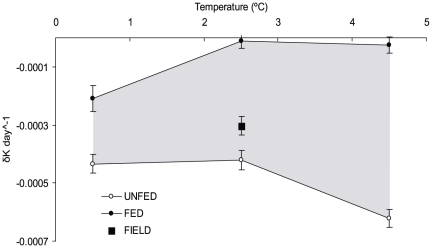
Figure 2. Average rate of change, calculated from regression coefficients, in relative body condition (δK day−1) for fed (filled circles) and unfed fish (open circles) at three different experimental temperatures.
Filled square indicate fish in Lake Krankesjön, where the average winter temperature during the study period was 2.51°C and shaded area indicate the potential range for rate of change at different temperatures dependent on food supply. Error bars indicate standard error on regression coefficients.

