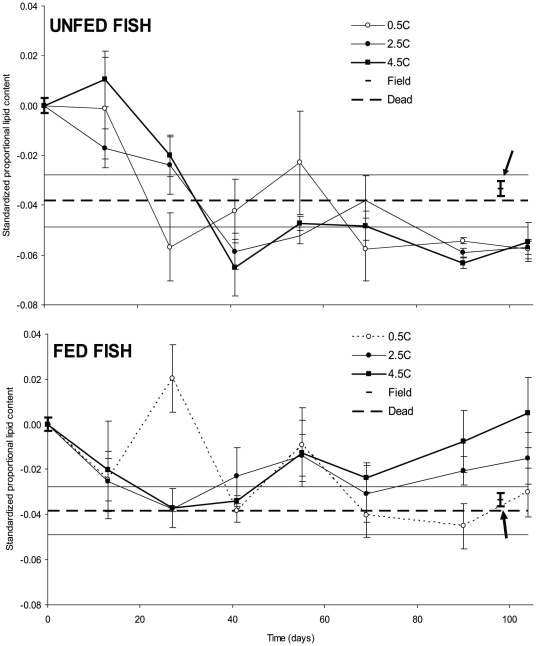
Figure 3. Standardized development of lipid content for unfed (top panel) and fed fish (lower panel) at three different experimental temperatures.
Values at day 0 are based on fish caught in the field and data for field caught fish at day 98 is indicated by arrows. The average proportional lipid content of fish caught on day 0 was 0.1435. All lipid contents are given as deviations from this value. Punctured horizontal lines indicate average (± S.E.) standardized lipid content of fish that died during the experiment. Error bars indicate S.E. and bold error bars indicate S.E. for fish caught in the field at day 0 and day 98.

