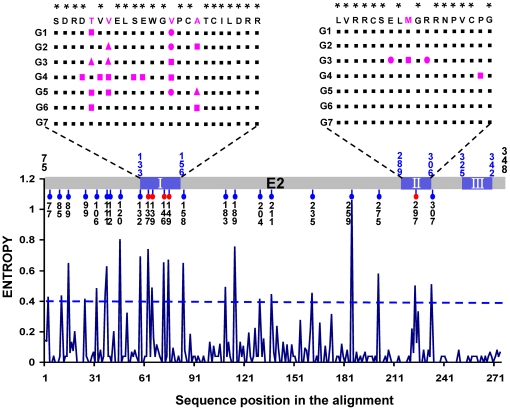
Figure 6. Analysis on amino acid sequences of E2 region.
The entropy score (a mathematical measure of variability) at amino acid positions 75-348 within E2 region, analyzed with 158 GBV-C isolates. The gray bar indicates the amino acid positions starting from 75 and ending at 348. Within the gray bar a blue area indicates the three putative GBV-C E2 peptides inhibited HIV infection corresponding to aa 133–156, 289–306 and 325–342. Five red and 18 blue dots linking under the gray bar represent the 23 positions having the entropy score ≥0.4 (regarded as high variability) hat is measure by the scale on the left. A curve under the gray bar plots the entropy score against each amino acid position that is numbered by the ruler at the bottom. The blue area of the gray bar is further expanded; it shows an alignment of the consensus amino acid sequences from seven GBV-C genotypes spanning the blue area. In the alignment, the reported HIV-1 entry blocking peptide domain of GBV-C E2 region are cited as the consensus sequence. Symbol * indicates the site with variation lower than 10%, which considered as conservation site. For comparison, 21 reference strains of genotype 1, 64 strains of genotype 2, 26 strains of genotype 3, 2 strains of genotype 4, 18 strains of genotype 5, 2 strains of genotype 6 and 25 strains of our discoved genotype 7 were apopted. The pink little tri-angle, diamond and disk represent the mutation in this site account for 10%-20%, 20-50% and more than 50% of total cited strains in this genotype, respectively.

