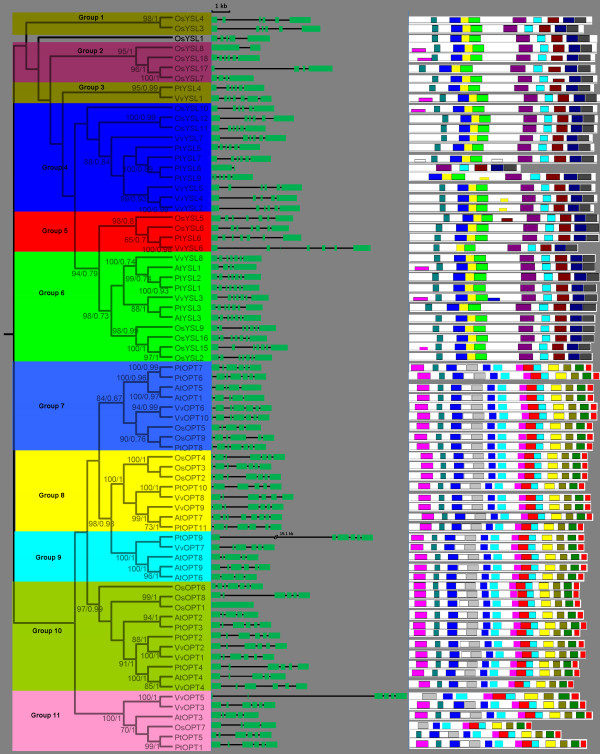
Figure 1.
Phylogenetic relationships, gene structure and motif composition of OPT genes in Arabidopsis (At), Populus (Pt), Vitis (Vv) and rice (Os). The molecular phylogeny (left panel) was constructed using full length OPT protein sequences from the four species. Numbers associated with branches show bootstrap support values for maximum likelihood analyses and posterior probabilities for Bayesian analyses, respectively. The 11 major groups designated from 1 to 11 are marked with different color backgrounds. Exon/intron structures of the OPT genes are shown in the middle panel. Green boxes represent exons and black lines represent introns. A schematic representation of conserved motifs (obtained using MEME) in OPT proteins is displayed in the panel on the right. Different motifs are represented by different colored boxes. Details of the individual motifs are in additional file 5: Sequence logo and regular expression of the different motifs identified in the OPT gene family.

