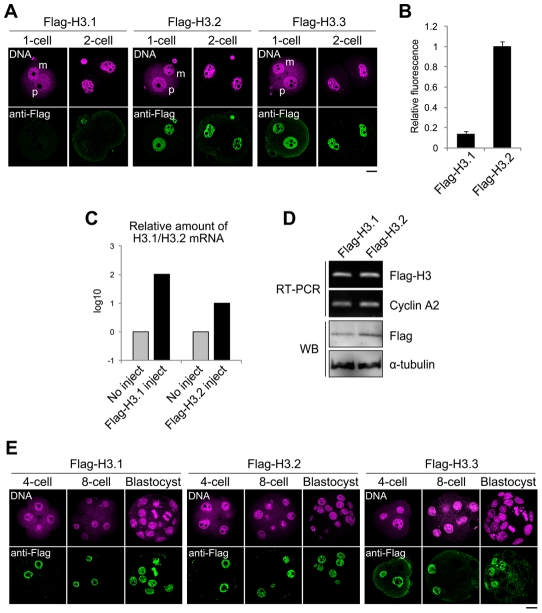
Figure 3. Incorporation of Flag-H3 variants into nuclei in preimplantation embryos.
(A) Immunofluorescence analysis of Flag-H3 variants in one- and two-cell embryos. MII-stage oocytes were microinjected with each Flag-H3 variant mRNA and then fertilized 2 h later. Staining with anti-Flag antibody was observed in the one- and two-cell embryos at 12 h and 28 h post-fertilization, respectively. m, maternal genome; p, paternal genome. The DNA was stained with PI. Scale bar, 20 µm. (B) The fluorescence intensity of Flag-H3.1 and Flag-H3.2 in the two-cell embryo was determined as described in the Materials and Methods section. The numbers of nuclei examined were 80 and 64 for the Flag-H3.1- and Flag-H3.2-injected embryos, respectively. (C) Quantitative RT-PCR analysis for H3.1 or H3.2 mRNA in two-cell embryos injected with or without Flag-H3.1 or Flag-H3.2 mRNA prior to fertilization. RT-PCR was performed using the primer pairs for the H3.1 or H3.2 open reading frames, which measured the total amounts of endogenous and injected mRNAs. The target mRNA level was normalized to the amount of exogenous rabbit α-globin mRNA in the same sample. The average value of duplicate experiments is shown. (D) Analysis of Flag-H3.1 and Flag-H3.2 mRNA and protein level in two-cell embryos by RT-PCR and immunoblotting (WB). RT-PCR was performed using a common primer pair recognizing exogenous Flag-H3.1 and Flag-H3.2 mRNA, but not endogenous H3.1 or H3.2. Endogenous cyclin A2 mRNA served as a control. Flag-H3.1 and Flag-H3.2 proteins were detected by immunoblotting with anti-Flag antibody. The relative values of the band densities of H3.1 vs. H3.2 were 0.63 vs. 1.0. Antibody against α-tubulin was used for the loading control. The experiments were conducted twice with similar results. (E) Immunofluorescence of Flag-H3 variants in late preimplantation embryos. Each Flag-H3 variant mRNA was microinjected into one blastomere of two-cell embryos. Therefore, signals for the Flag-H3 variants were detectable in half of the blastomeres. Deposition of each H3 variant in embryos at the four-cell, eight-cell, and blastocyst stages was examined at 44 h, 56 h, and 80 h post-fertilization, respectively. Scale bar, 20 µm.

