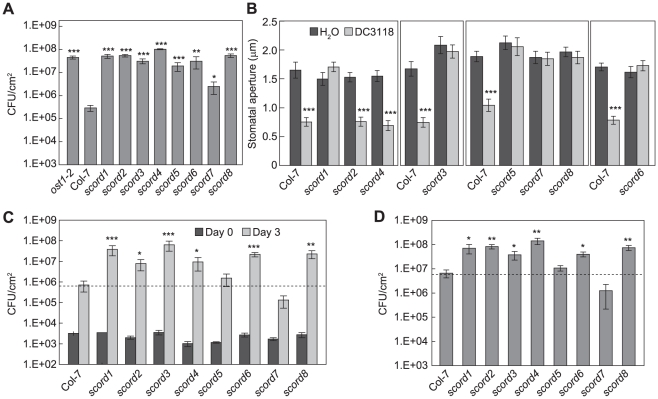
Figure 1. Characterization of scord mutants.
(A) Pst DC3118 population at 3 dpi after dip-inoculation at 1×10⁸ CFU/ml. (B) Stomata apertures (µm) from leaf peels incubated with Pst DC3118 (1×10⁸ CFU/ml) for 1 h. (C) Pst DC3118 populations when inoculated by infiltration at 1×10⁶ CFU/ml. (D) Pst DC3000 population at 3 dpi after dip-inoculation at 1×10⁷ CFU/ml. Differences were detected by comparing each scord mutant with Col-7 for (A), (C) and (D) Statistical analyses for this and following figures are described in MATERIALS and METHODS.

