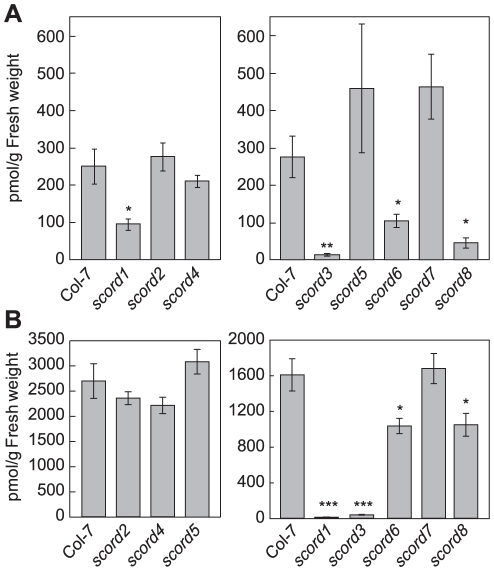
Figure 3. Salicylic acid (SA) levels in leaves of Col-7 and scord mutants.
Numbers represent means and standard errors of values from 4 different plants. Similar results were obtained from two different experiments. (A) Plants without treatment. (B) Plants were infiltrated with Pst DC3000 at 1×10⁸ CFU/ml. Leaves were collected at 12 hpi.

