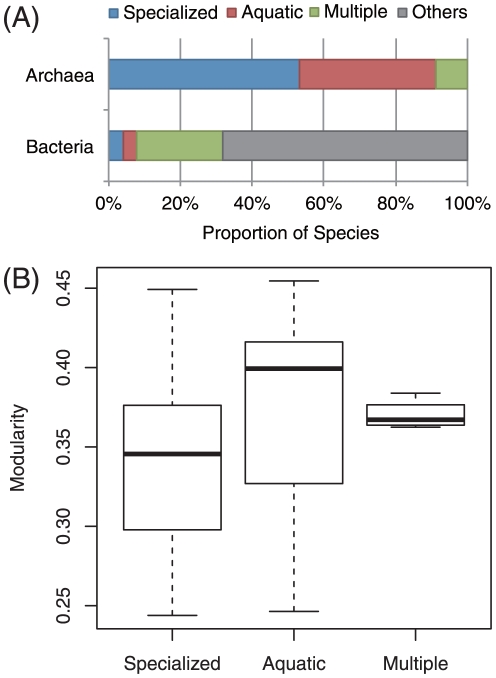
Figure 1. Effect of habitat variability on metabolic network modularity ( ).
).
(A) The ratio of species in each category of environmental variability between the archaea and bacteria; values for bacteria were obtained from published data [14]. (B) No relationship was observed between metabolic network modularity and habitat variability in archaea ( -value
  , using the Kruskal–Wallis test). The degree of environmental variability increases in the following order: specialized, aquatic, and multiple.

