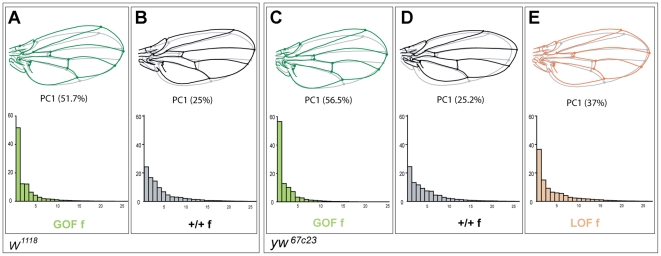
Figure 4. Patterns of wing shape FA in GOF, control and LOF female flies.
Principal component analysis (PCA) of the wing shape FA matrices (note that since the PCAs were ran independently, eigenvalues are not directly comparable). GOF flies in the w1118 and yw67c23 backgrounds (same individuals as in Figure 1 and Figure S3A, S3B, S3C, respectively) and LOF flies in the yw67c23 background (same individuals as in Figure S3D, S3E, S3F) were analyzed (see Table S4 for values). Only females are represented here. Top: Patterns of wing shape asymmetry associated with the first PC of the FA matrices. Grey shape: consensus wing computed from all wings; colored shape: shape asymmetry associated with the first principal component (PC). Bottom: Histograms of FA eigenvalues (i.e. amount of shape variance explained by each PC). Green: GOF flies (A, C); grey: control flies (B, D); orange: LOF flies (E).

