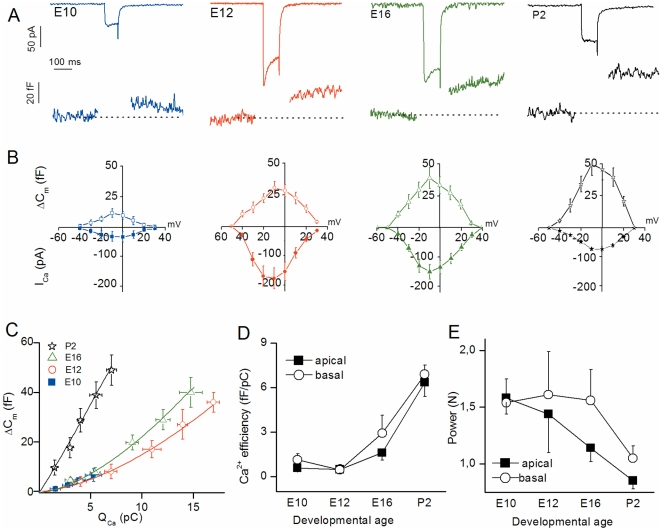
Figure 1. Ca2+ efficiency of RRP exocytosis increases with maturation.
(A) Examples of ICa and ΔCm recordings following a 100 ms-voltage step from holding potential of -90 mV to -10 mV at E10, E12, E16, and P2 basal HCs. (B) Voltage-dependence of ICa and ΔCm recorded in basal HCs at E10 (n = 6), E12 (n = 9), E16 (n = 9) and P2 (n = 7). ICa was measured at its peak value during the voltage pulse shown in A. To limit depression, each consecutive voltage-step was separated by a 30 s recovery period. (C) Synaptic transfer functions relating QCa (charge integral of Ca2+ current) and ΔCm in basal HCs. Data points were fitted using first order power function with ΔCm = s[ICa]N, where s = slope factor (Ca2+ efficiency; fF/pC) and N = power index or degree of co-operativity. Values of s and N are reported in table 1. (D) Comparative Ca2+ efficiency (ΔCm/QCa) in apical (E10, n = 10; E12, n = 13; E16, n = 11; and P2, n = 9) and basal HCs (n as in B) as a function of developmental age. (E) Comparative cooperative (power) index N from power fit of data in D as a function of age in developing apical and basal HCs.

