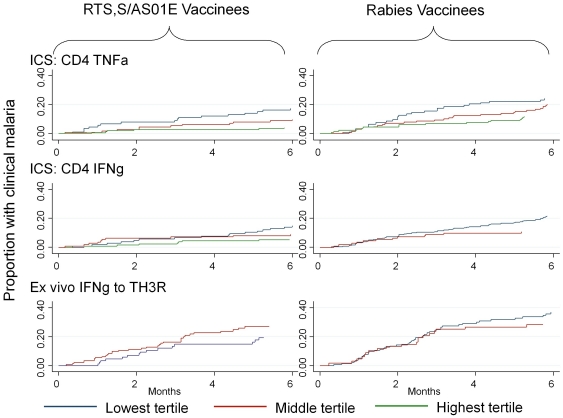
Figure 4. Survival plots with time to first episode of clinical malaria plotted for RTS,S/AS01E (left columns) and control vaccinees (left and right columns) according to tertile of CD4+, TNFα responses (top row), CD4+ IFNγ responses (middle row) and IFNγ ex vivo ELISPOT responses to TH3R/CS.T3T peptides pool (lower row).
Where more than one third of responses were at the lower limit of detection, the lower two tertiles are combined (and hence only 2 tertiles are displayed on some plots). For CD4+ TNFα+ responses, the tertiles were 1 to 154 (lower), 155 to 407 (middle) and 408 to 28,840 (upper) cells per million for RTS,S/AS01E vaccinees, and 1 to 26 (lower), 27 to 165 (middle) and 166 to 10,000 (upper) cells per million for control vaccinees. For CD+ IFNγ+ responses the tertiles were 1 to 12 (lower), 13 to 66 (middle) and 67 to 8,320 (upper) cells per million for RTS,S/AS01E vaccinees, and 1 to 40 (lower) and 41 to 5,980 (upper) cells per million for rabies vaccinees. The time point “0 months” refers to the time of a blood draw. Cellular responses were analyzed as time-varying covariates, where the effect of cellular responses from all available blood draws was related to clinical malaria episodes during the period of monitoring after each measurement. Therefore, each RTS,S vaccinee could contribute to 2 periods of monitoring. These three assays were selected for the figure because significant associations on Cox regression were seen (Table 4).

