
Figure 5. Effect of TSG on 6-OHDA-induced accumulation of intracellular ROS levels.
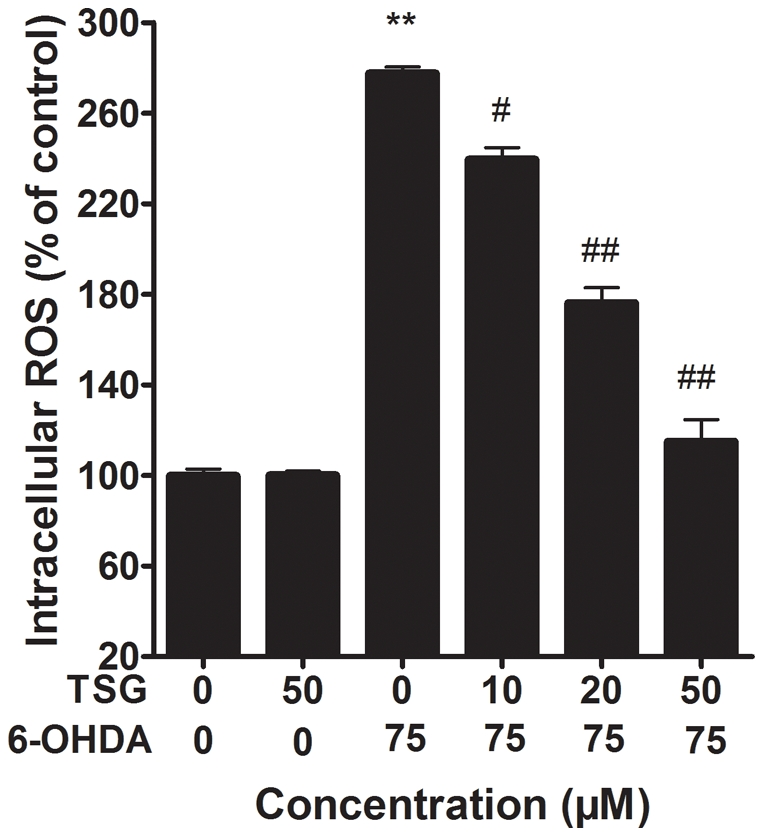
Cells were pretreated with different concentrations of TSG for 24 h and then incubated in 6-OHDA for an additional 24 h. Intracellular ROS levels were measured using DCFH-DA. Data are expressed as percentage of untreated control cells ± standard deviation (n = 6). **P<0.01 versus untreated control cells; # #P<0.01 versus 6-OHDA-treated cells.