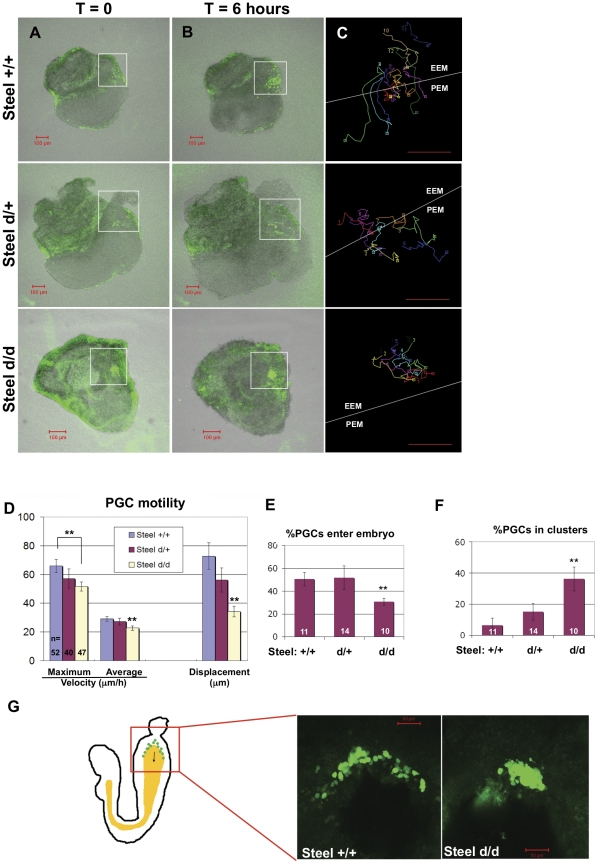
Figure 3. PGC migration in Steeld/d embryos at E7.5.
(Column A, B) Frames at t = 0 and t = 6 hours respectively from movies of E7.5 embryos with different Steel-dickie genotypes. (Column C) Tracks were made from PGCs in the allantois (white boxes) that remained in the plane of the confocal image throughout the movies. The white line in C indicates the boundary between the extraembryonic tissues (EEM), and the posterior end of the embryo (PEM). Scale bars in (A–C): 100 µm. (D) The maximum velocity, average velocity, and displacement of E7.5 PGCs with different Steel-dickie genotypes. PGCs in Steeld/d embryos showed significantly decreased velocities and displacement compared to wild type littermates. “n” indicates the number of PGCs used for quantitation. Units on the “Y” axis vary based upon parameter, and are indicated below the bar charts. ** = p<0.01. (E) The percentage of PGCs which enter the posterior of the embryo is significantly reduced in Steeld/d embryos. (F) The percentage of PGCs which form clusters is dramatically increased in Steeld/d embryos. “n” indicates the number of embryos used for quantitation for (E) and (F). ** = p<0.01. (G) PGCs in E8.0 wild type and Steeld/d embryos. The left diagram shows an E8.0 embryo with PGCs migrating along the hind gut (yellow). Arrow shows the direction of PGC migration. Red box indicates the area shown in the image on the right.

