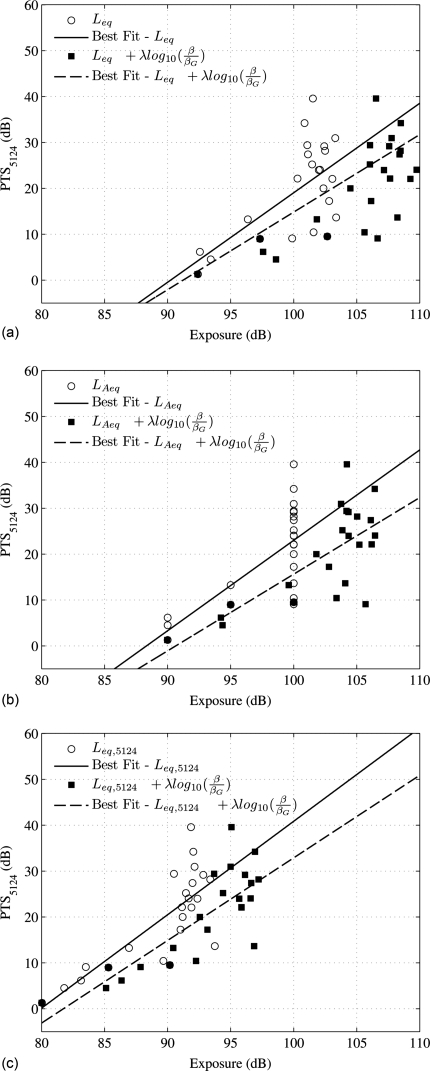
Figure 1.
Scatter plots of the PTS5124 values against the metric values with the regressed lines. Each point represents the pair of the average PTS5124 of the chinchillas in the group exposed to one specific type of noise and the metric calculated for the noise. (A) against Leq and L′eq, (B) against LAeq and L′Aeq, and (C) against Leq,5124 and L′eq,5124. It is seen that adding the kurtosis correction term improves the correlation between the metric and PTS5124.

